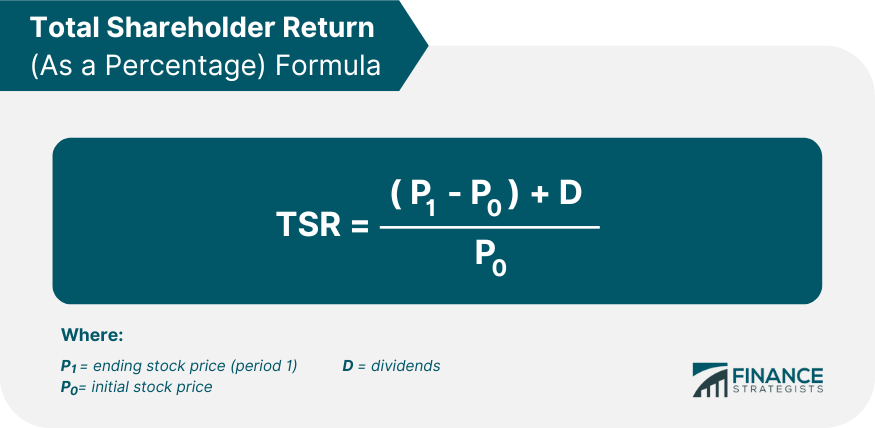
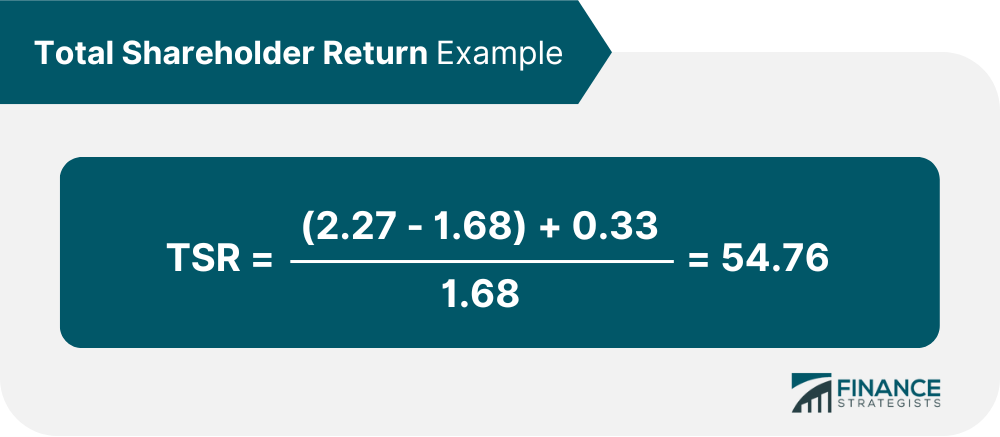
The total shareholder return (TSR), also known as the total stock return or total return, is the total amount of money that a shareholder would make from each individual stock. This amount takes into account both capital gains and dividends for a specified period of time. Any time you’re making an investment, you want to know what it will produce for you. If you are not seeing a return on the money you invest, then it’s not worth the time it took to invest in it. With that in mind, understanding the stock return helps you to see the full cash value that is coming back to you because of your investment. There are a couple of different ways that stocks can give you a return on your investment. You can make money because of the increase from the stock itself as it rides the market. Or, you could receive income from the company in the form of dividends. The stock return formula pools all of these returns together to give you a big-picture perspective on your investment. In this formula, the dividends would include any money that has been paid out to the shareholder by the company. Dividends are cash amounts paid, usually quarterly, to the shareholders depending on the number of shares they own. A business would base its dividends off of its net income, or income minus expenses. However, companies will often pay out one-time dividends in addition to these quarterly amounts. These one-time payments would be included in variable D. Since the beginning and ending stock prices represent a period of time, anything listed in variable D should be anything paid out over that time period. The results of the stock return formula can also be expressed as a percentage. For that form, you would need to use this formula: Essentially, you would take the result from your original formula and divide it by the initial stock price. Either one is acceptable, so you should base what you choose on context. For instance, the total shareholder return for a stock could be $9 or 12% over three years. A publicly traded company that manufactures baby supplies wants to assess its overall performance on the market compared to its competitors. Their beginning stock price for the year was $1.68 per share. Their ending stock price was $2.27 per share. They paid $0.33 in dividends to each share. What is their total shareholder return rate? Let’s break it down to identify the meaning and value of the different variables in this problem: We can apply the values to our variables and calculate the total return: In this case, they would have a $0.92 stock return cash value and a 54.76% total shareholder return rate. Now, the company can look at these numbers and compare how they are doing to other baby product companies on the market. Because they are seeing a strong improvement and consistent dividends, they are probably doing just fine as a growing business. These are the types of numbers investors might want to see. However, if they look around at heir market and see they are lagging behind, they could use this information to make a change. Since this formula covers a wide range of variables, there are many things they could do to improve. They could work to increase assets, lower expenses, find growth opportunities, etc. The total shareholder return formula is a calculation that allows you to get a clearer understanding of the health of a company, especially in comparison to the rest of the market. You can use this tool to compare the financial return and its rate with other stocks, whether or not they provide dividends. The stock return is a nice leveller to help you make the right investment decisions for your money. Imagine you have two stocks. One has no dividends, but the stock price is steadily increasing; the other has dividends but is moving a little slower. How do you know which to invest in? Thanks to the stock return formula, you can compare how they’ve performed to see which is giving you the most money in total. Some investors only prefer to focus on how the stock performs on the market. They watch their stocks carefully to see whether they have moved up or down over time. If they move up, they make capital gains on that appreciation. They brush aside the dividends as not being as important as the stock’s movement. On the other hand, there are investors who don’t care as much about how the stock does on the market. In their minds, the stock will continue to go up and down. To them, there’s no use focusing on that. Instead, they want to see dividends – cash in hand. They prefer to look at dividends as the key metric to the company’s health. While each indicator is important, the stock return formula can harness them together for a more accurate reading. Looking at both capital gains and dividends, you have more information to either calculate a company’s success rate or project potential performance. You can use the total shareholder return calculator below to find out the total return on your stock investment by entering the required numbers. Ending Stock Price Dividends Initial Stock Price Stock Return Cash Value Total Shareholder Return Total Shareholder Return Formula

Total Shareholder Return Example
Total Shareholder Return Analysis
Total Shareholder Return Conclusion
Total Shareholder Return Calculator
Total Shareholder Return (TSR) FAQs
Total Shareholder Return (TSR) is a performance measure used to evaluate returns generated by an investment in a company’s stock. It combines capital appreciation with dividend income realized over a specified period of time.
TSR is calculated by taking the sum of all capital gains and dividends produced over a specified period, then dividing it by the original investment amount.
TSR provides investors with an effective way to assess overall performance over a given time period, as well as compare returns across different investments. It also serves as an important metric for assessing executive compensation and corporate performance.
When evaluating TSR, it is important to consider the total cost of investing in a company’s stock including commissions and fees, taxes, dividends, and other expenses associated with the investment. Additionally, it is important to take into account any changes in the market over time that may have impacted the return on investment.
In addition to TSR, other metrics such as Return on Investment (ROI), Earnings Per Share (EPS), and Price/Earnings Ratio (PER) can be used to measure the performance of an investment. Additionally, investors and analysts may also consider factors such as market sentiment and macroeconomic trends when assessing an investment’s performance.
True Tamplin is a published author, public speaker, CEO of UpDigital, and founder of Finance Strategists.
True is a Certified Educator in Personal Finance (CEPF®), author of The Handy Financial Ratios Guide, a member of the Society for Advancing Business Editing and Writing, contributes to his financial education site, Finance Strategists, and has spoken to various financial communities such as the CFA Institute, as well as university students like his Alma mater, Biola University, where he received a bachelor of science in business and data analytics.
To learn more about True, visit his personal website or view his author profiles on Amazon, Nasdaq and Forbes.