The 52-week high/low is the highest and lowest price at which a security, such as a stock, has traded over the prior 52-week period. It is a measure used by investors to analyze a stock's current price and help predict its future movements. A stock may garner more attention from investors as it nears its 52-week high or 52-week low. The 52-week high/low measures the highest and lowest stock prices within the last 52 weeks or one year. The 52-Week High is the highest price a stock has reached in the past year, while the 52-Week Low is the lowest price a stock has reached in the past year. Investors and traders commonly use this metric to evaluate a stock's performance over extended periods. Calculating the 52-week high/low is a relatively simple process that involves tracking a stock's highest and lowest prices over the past year. Investors can access this information through various sources, including financial news websites, stock market tracking apps, and online trading platforms. These sources provide 52-week high/low information for individual stocks and entire indices and sectors. Investors can also calculate the 52-week high/low by tracking the stock's price movements over time. To do this, they need to monitor the stock's daily closing prices and identify the highest and lowest prices over the past 52 weeks. This can be done using a spreadsheet or other tracking tools that allow investors to analyze a stock's price movements easily. In addition to tracking the highest and lowest prices, investors may consider other factors when calculating the 52-week high/low. For example, they may want to adjust for stock splits or other corporate actions impacting the stock's price history. They may also want to consider any dividends or other distributions the stock has paid over the past year, as this can impact its overall performance. The 52-week high/low is significant because it gives investors a longer-term perspective on a stock's performance. Unlike other metrics that only consider a stock's performance over the last few days or weeks, the 52-week high/low considers the stock's performance over the past year. This can provide a more accurate picture of the stock's performance and help investors make more informed investment decisions. Investors track the 52-week high/low for various reasons. One of the primary reasons is to identify stocks that are trending upward or downward. If a stock has recently reached its 52-Week High, it may indicate that it is currently performing well and may continue to do so. Conversely, if a stock has recently reached its 52-Week Low, it may suggest that it is underperforming and may continue to do so. One of the benefits of using the 52-week high/low as an indicator is that it provides investors with a longer-term perspective on a stock's performance. This can help identify trends and make more informed investment decisions. Another advantage is that the 52-week high/low can help investors identify currently overvalued or undervalued stocks. However, there are also some disadvantages to using the 52-week high/low as an indicator. One of the main disadvantages is that it may need to be more accurate in predicting short-term price movements. Additionally, the 52-week high/low may not consider external factors influencing a stock's price, such as changes in the overall market or news events that may impact the company. Investors can use the 52-week high/low to evaluate stocks in various ways. One of the primary ways is to identify stocks that have recently reached their 52-Week High or 52-Week Low. If a stock has recently reached its 52-Week High, investors may want to consider buying it, as it may continue to perform well. If a stock has recently reached its 52-Week Low, investors may want to consider selling it or avoiding it altogether, as it may continue to underperform. In addition to identifying stocks that have recently reached their 52-Week High or Low, investors can also use the 52-week high/low to compare a stock's current price to its historical performance. For example, if a stock is trading near its 52-Week High, investors may want to evaluate whether it is overvalued or undervalued based on its historical performance. If the stock has historically traded at a higher price, it may be overvalued, while if it has historically traded at a lower price, it may be undervalued. There are various factors that can influence a stock's 52-week high/low. One of the primary factors is the company's financial performance. If a company performs well financially, its stock price may increase, leading to a higher 52-Week High. Conversely, if a company is not performing well financially, its stock price may decrease, leading to a lower 52-Week Low. External factors can also influence a stock's 52-week high/low. For example, changes in the overall market or changes in interest rates can impact a stock's price and influence its 52-week high/low. News events, such as mergers and acquisitions or changes in leadership, can also impact a stock's price and influence its 52-week high/low. To overcome some of the 52-week high/low limitations, investors may want to use it with other metrics. For example, investors may consider a stock's price-to-earnings (P/E) ratio or dividend yield in addition to its 52-week high/low. Investors can better understand a stock's performance and potential using multiple metrics. The 52-week high/low metric gives investors a longer-term perspective on a stock's performance. It can be a valuable tool for identifying trends and making informed investment decisions. While the 52-week high/low has some limitations, it can be combined with other metrics to understand a stock's performance and potentially better. Investing in the stock market can be complex and challenging, and making informed decisions to achieve your financial goals is essential. If you are looking to invest in the stock market but feel overwhelmed, consider hiring a financial advisor who specializes in wealth management services to help you confidently navigate the market. With their knowledge and experience, a financial advisor can help you make informed investment decisions and create a personalized investment plan that aligns with your financial goals.What Is the 52-Week High and Low?
What Is 52-Week High/Low?
Calculating 52-Week High/Low
Significance of 52-Week High/Low
Why Investors Track 52-Week High/Low
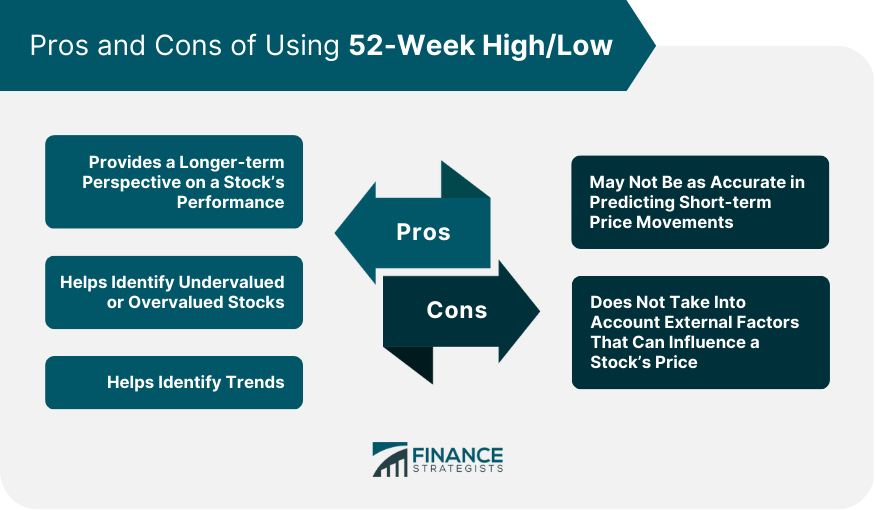
Pros and Cons of Using 52-Week High/Low as an Indicator
Using 52-Week High/Low to Evaluate Stocks
Factors That Can Influence a Stock’s 52-Week High/Low
Using 52-Week High/Low in Combination with Other Metrics
Conclusion
52-Week High/Low FAQs
The 52-week high/low measures the highest and lowest stock prices within the last 52 weeks. It is important for investors because it provides a longer-term perspective on a stock's performance and can help identify trends.
Investors can calculate the 52-week high/low of a stock by tracking the highest and lowest prices of the stock over the past year. This can be done manually or with the help of online tools.
The advantages of using the 52-week high/low as an indicator include providing investors with a longer-term perspective on a stock's performance, helping identify undervalued or overvalued stocks, and identifying trends.
The limitations of using the 52-week high/low as an indicator include not being as accurate in predicting short-term price movements and not considering external factors that can influence a stock's price.
Investors can use the 52-week high/low to evaluate stocks by identifying stocks that have recently reached their 52-Week High or Low, comparing a stock's current price to its historical performance, and considering other metrics combined with the 52-week high/low.
True Tamplin is a published author, public speaker, CEO of UpDigital, and founder of Finance Strategists.
True is a Certified Educator in Personal Finance (CEPF®), author of The Handy Financial Ratios Guide, a member of the Society for Advancing Business Editing and Writing, contributes to his financial education site, Finance Strategists, and has spoken to various financial communities such as the CFA Institute, as well as university students like his Alma mater, Biola University, where he received a bachelor of science in business and data analytics.
To learn more about True, visit his personal website or view his author profiles on Amazon, Nasdaq and Forbes.