Beta (β) measures a stock's volatility or the degree to which its price fluctuates relative to the market as a whole. A benchmark index is chosen to represent the market in the beta calculation. An analyst will generally select an index most appropriate to compare with the chosen stock. For instance, the S&P 500 (Standard & Poor's 500) can be used to calculate the beta of a large U.S. company. Beta is also a crucial component in the capital asset pricing model (CAPM), which demonstrates the relationship between the expected returns and the systematic risk of investing in particular securities. Beta can be classified into two types: levered beta and unlevered beta. Levered beta compares the performance of a particular stock to that of the market while considering the company's debt and equity. Also known as equity beta, it is calculated as follows: Unlevered beta, or asset beta, also assesses the performance of a security in response to market fluctuations. However, unlevered beta eliminates the financial consequences of leverage, isolating the risk attributable to the company's equity alone. It is calculated as follows: The beta formula is relatively simple. It is calculated using two specific components, covariance and variance. Covariance measures how two stock prices move together. Usually, one of the stock prices used in covariance comes from a specific market index like the S&P 500. Positive covariance suggests that the prices of the two stocks will likely move in the same direction. Conversely, a negative covariance indicates that the value of the two stocks moves in opposing directions. Variance measures how far a stock fluctuates when compared to its mean. In the beta calculation, the market's movement is often the one being measured by the variance. Variance is associated with volatility, which is neither positive nor negative in and of itself for investors. High variance means high volatility and is associated with greater risk and return. In contrast, low variance means lower volatility and is associated with reduced risk and return. Below is the beta formula, which breaks down how both covariance and variance are computed. Once you have calculated the beta, you need to interpret the value to understand the stock's risk. When looking at a stock's beta, it is essential to remember that this measures how closely the stock price moves compared to the market as a whole. Beta values can range from less than 1 to greater than 1. Meanwhile, the market's beta is generally considered to be 1. A beta of 1.0 implies that the stock is highly correlated with the market. Adding a stock with a beta of 1.0 to a portfolio will not increase its overall risk, but it also does not increase the chances that it will outperform the market. A beta value below 1.0 means that a security is less volatile than the market, making it a less risky addition to a portfolio. For instance, utility stocks often have low betas because they have a more stable value and move more slowly than market averages. Including such stocks in a portfolio can help to mitigate overall risk. A beta value greater than 1.0 signifies that the theoretical volatility of the security's price exceeds that of the market. For example, if a stock's beta is 1.5, it is expected to be 50% more volatile than the market. Small-cap and technology stocks typically have higher betas than the market benchmark. Adding this type of stock to a portfolio will raise its risk, but it may also improve its expected return. A stock with a negative beta is inversely correlated to the market benchmark, meaning that when the benchmark goes up, the stock goes down, and vice versa. Put options and inverse ETFs are designed to have negative betas, which means they track the opposite of the benchmark's trends. There are also a few industry groups, such as gold miners, where a negative beta is typical. Let us take, for example, an investor who wants to calculate the beta of Nike compared to the S&P 500. Based on recent six-year data, Nike and S&P 500 have a covariance of 18.75, and the variance of Nike is 48.06. Beta of Nike = Covariance / Variance = 18.75 / 48.06 = 0.39 The investor also wants to calculate the beta of Coca-Cola in comparison to the S&P 500. The recent six-year data shows that Coca-Cola and S&P 500 have a covariance of 14.15, and the variance of Coca-Cola is 26.59. Beta of Coca-Cola = Covariance / Variance = 14.15 / 26.59 = 0.53 Both companies presented have betas of less than one, meaning that they are less volatile than the market in general. However, Coca-Cola's slightly higher beta means it might be a bit more volatile than Nike. Here are some pros involved in using beta: Using beta also has some cons, including: Alpha and beta are metrics that investors use to analyze the risk of a security or portfolio. Beta measures a stock's correlation to the market, which can help project its returns. Meanwhile, alpha compares a particular stock's actual performance to the market's performance. Both are essential financial metrics, primarily when used alongside each other. In either case, the market is represented by a selected index, such as the S&P 500. For example, let us say an investor bought shares of Stock OW. This stock has a beta of 1.5, which is 50% more volatile than the market. However, this also means it could earn 50% more than the market can return in a given period. One year later, Stock OW gained an annual return of 20% while the S&P 500 only grew by 12%. In this case, Stock OW has a positive alpha because the investor earned more than the projected investment risk. Based on the beta, the particular stock could have grown to only 18%, 50% more than the market's return. However, based on its actual performance, the stock outperformed the S&P 500 by 8%. This return is even more than what was projected by its beta. Beta and alpha can help analysts review past investments and plan for new ones when taken together. Beta refers to the volatility of a stock in relation to the market. A benchmark index, such as the S&P 500, is chosen to represent the market in the beta calculation. There are two types of beta: levered and unlevered. Levered beta considers the company's debt and equity, while unlevered beta isolates the risk attributable to the company's equity alone. Beta is calculated using two specific components, covariance and variance. A beta value of more than 1.0 implies that the stock will be more volatile than the market, while a beta value of less than 1.0 predicts lower volatility. Typically, volatility is a sign of risk, with higher betas suggesting greater risk and lower betas projecting lower risk. Thus, stocks with more significant betas may gain more during bull markets. However, these stocks may also have more significant losses in bear markets. Beta can be used to help diversify a portfolio and make better investment decisions. However, beta is only one measure of risk and should not be used in isolation since it only measures past performance. Instead, beta can be used with other metrics like alpha, which tells an investor whether the actual returns on investment exceeded what its beta projected.What Is Beta?
Types of Beta
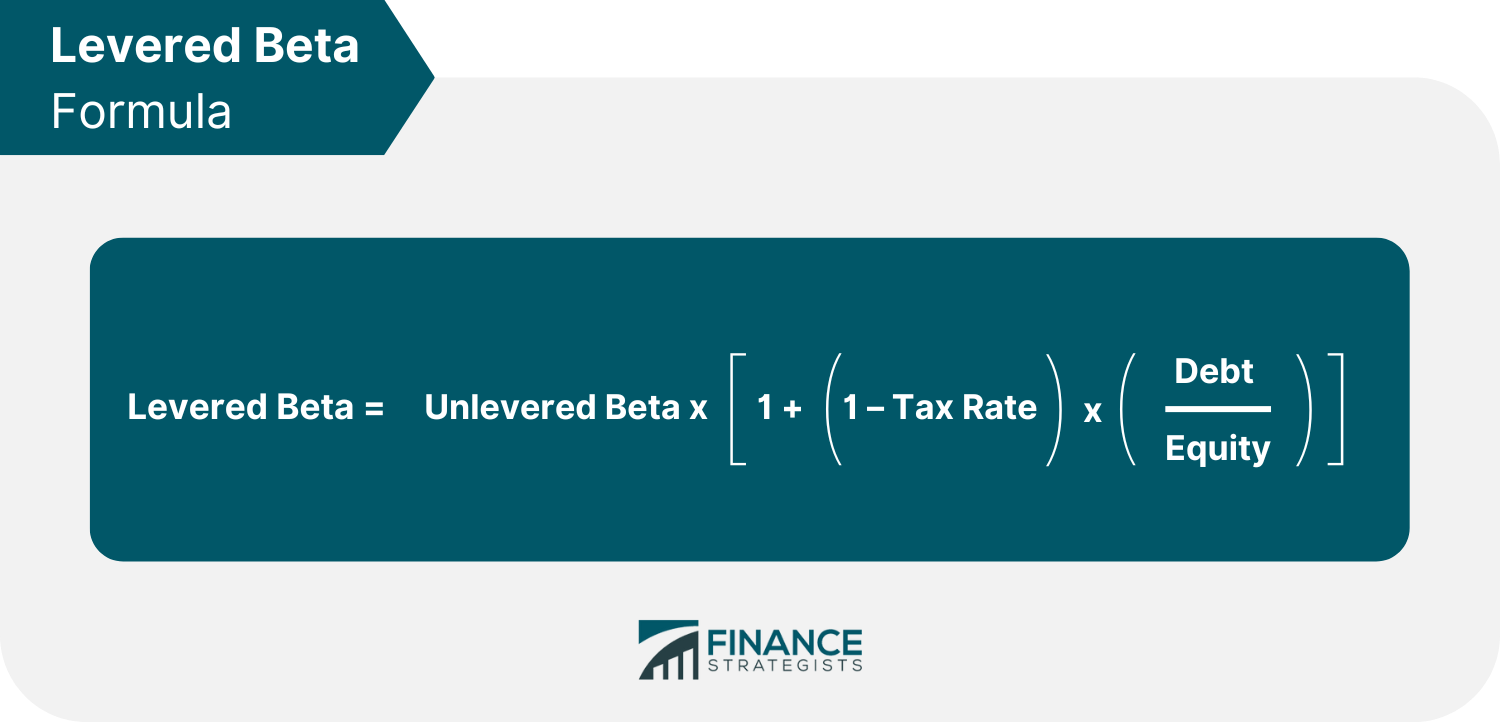
Levered Beta
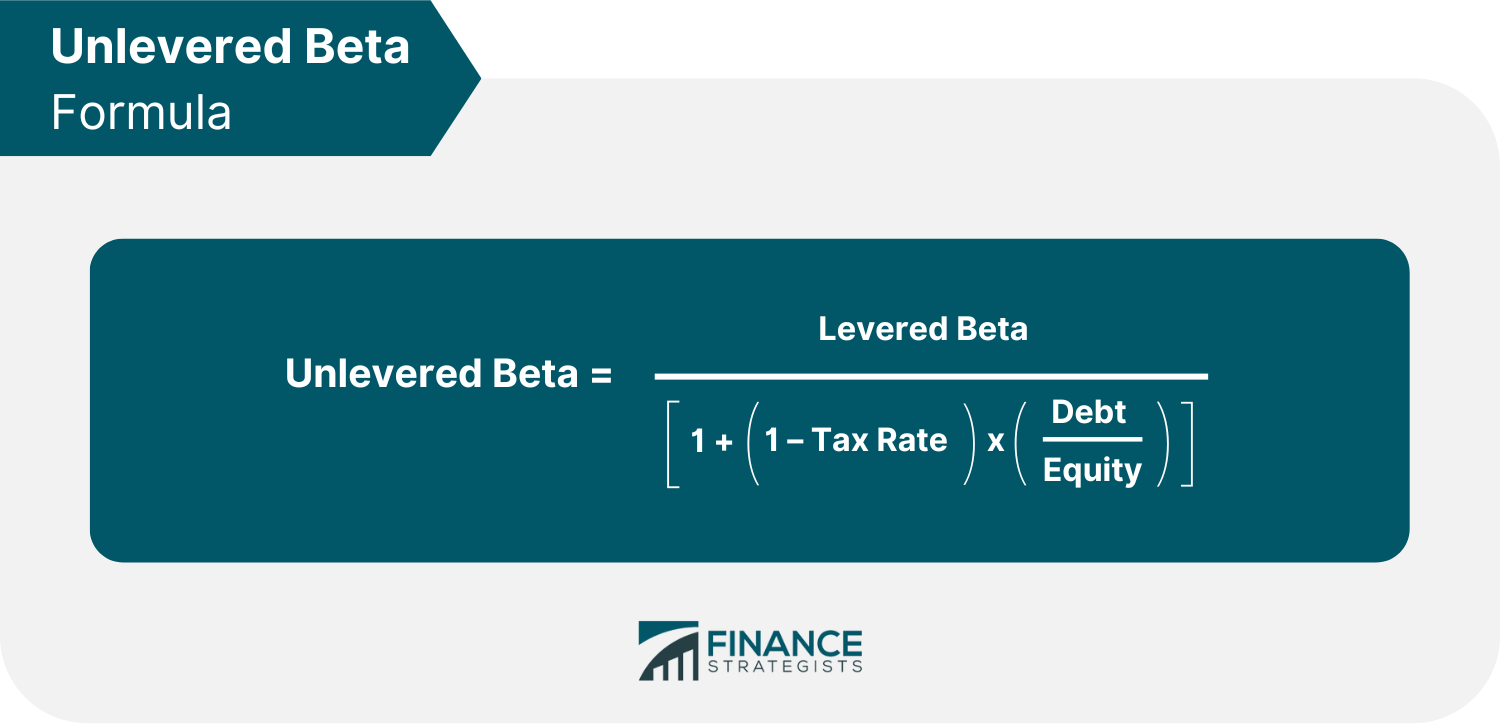
Unlevered Beta
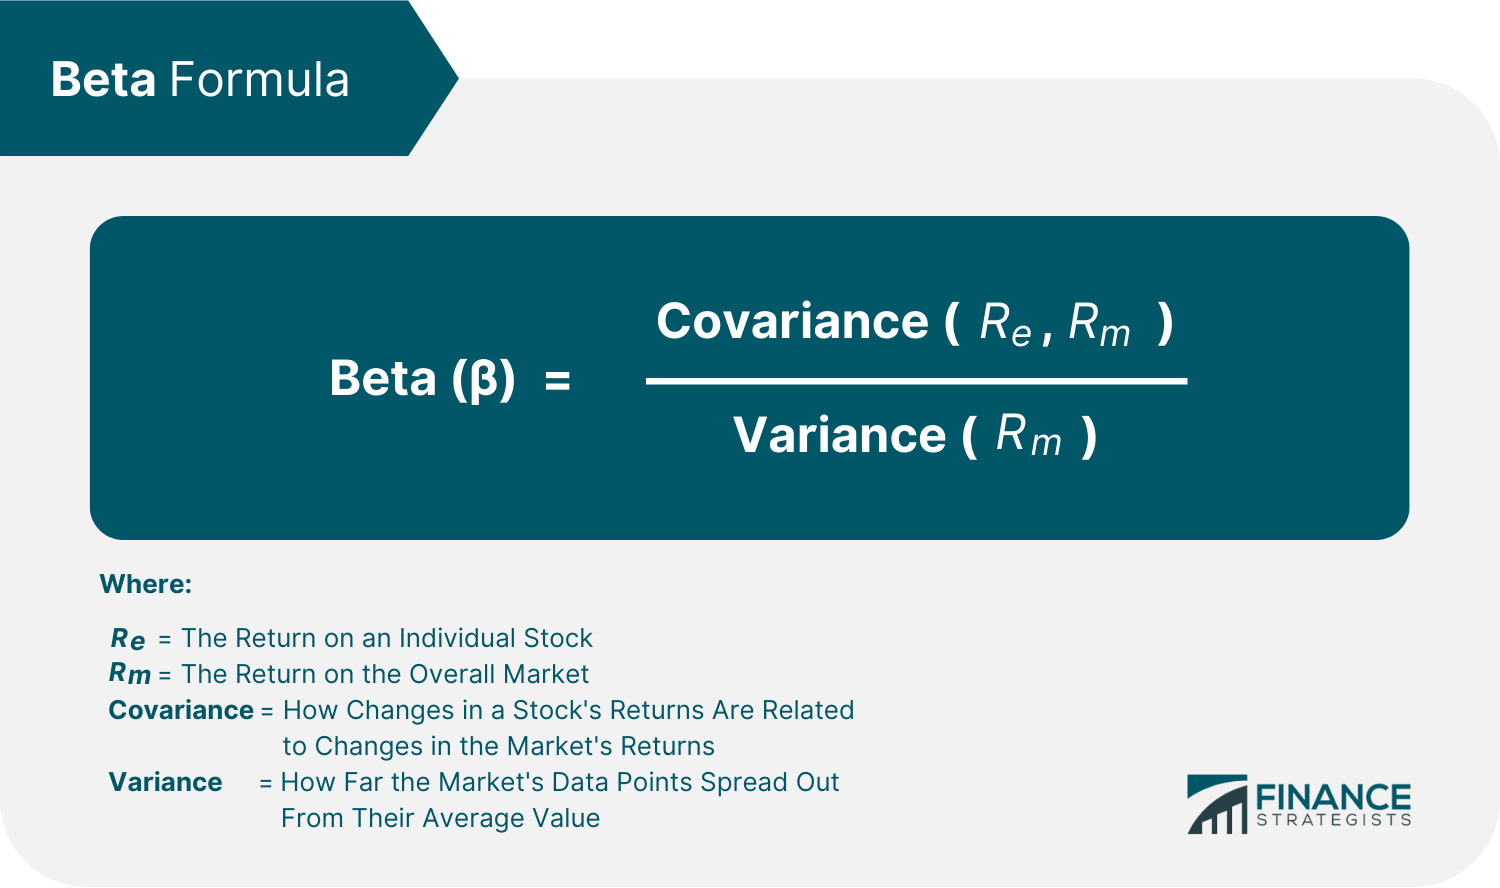
Beta Formula
Covariance
Variance
Beta Values Interpretation
Beta Value Equal to One
Beta Value Less Than One
Beta Value Greater Than One
Negative Beta Value
Examples of Beta Calculation
Advantages of Beta
Disadvantages of Beta
Beta vs Alpha
Final Thoughts
Beta FAQs
A beta value of more than 1.0 implies that the stock will be more volatile than the market, while a beta value of less than 1.0 predicts lower volatility. In a bull market, a beta above 1.0 will likely produce better returns but also come with more risk.
Beta is calculated using two specific components, covariance by variance. Covariance measures how the stock moves in relation to the market, while variance measures how far a stock fluctuates compared to its mean.
In the case of levered beta, the beta increases as a company’s total debt level rises.
Beta is a measure of the expected movement of a stock relative to the market as a whole. A beta greater than 1.0 implies that the stock is more volatile than the market, whereas a beta less than 1.0 indicates that the stock is less volatile.
A beta of 1.0 indicates a strongly correlated stock with the same risk level as the market. Meanwhile, a beta below 1.0 suggests the security is less volatile than the market, making it a less hazardous portfolio addition. On the other hand, a beta value above 1.0 means the security's price is more volatile than the market. Finally, with a beta of -1.0, a stock is negatively connected to the market benchmark.
True Tamplin is a published author, public speaker, CEO of UpDigital, and founder of Finance Strategists.
True is a Certified Educator in Personal Finance (CEPF®), author of The Handy Financial Ratios Guide, a member of the Society for Advancing Business Editing and Writing, contributes to his financial education site, Finance Strategists, and has spoken to various financial communities such as the CFA Institute, as well as university students like his Alma mater, Biola University, where he received a bachelor of science in business and data analytics.
To learn more about True, visit his personal website or view his author profiles on Amazon, Nasdaq and Forbes.