Scalping is a trading strategy where investors use small price changes to create several small profits, which then quickly grow into larger ones. A scalper usually places many trades throughout the day, ranging from five to 200 or more. Doing this minimizes the risk of significant losses while still guaranteeing themselves a profit. This strategy, scalping combined with exit strategies designed to prevent losses, can help them increase potential profits. Scalping may be done manually or automatically. Manual scalping necessitates using a specialist who is aware of the approach and can look for indications in the market that indicate when to execute rapid buy and sell operations. Their objective is to make as much money as possible while avoiding losses. Automated scalping systems rely on various signals provided by technical analysis charting tools and indicators, which tell the system when to acquire or sell stock. Automated scalping systems can scalp the market by using several successful strategies, saving time and energy. Scalping has both advantages and disadvantages, just like any other investment approach. When done by an expert trader, the risks are low, and the losses can generally be avoided. Anyone may develop their experience in this approach with time and practice, and some simple techniques can help beginners avoid taking too much risk exposure. Before we go into that, listed below are the benefits and drawbacks of scalping: When done correctly, scalping can be an incredible trading technique for maximizing profits slowly and consistently. Furthermore, the strategies shared here are extremely simple to grasp and can be mastered by anyone. When done correctly, scalping can increase your income and bring you closer to the financial freedom you deserve. The foreign exchange market, also called Forex, FX, or the currency market, is where trading different currencies at current or predetermined prices occur. It is the largest market in the world by the volume of trades being made. Scalping in the foreign exchange market necessitates the use of real-time analysis to execute currency transactions to make a profit. Because this market is huge, it is an excellent location to practice and execute scalping techniques. Listed here are four of the greatest scalping methods available in this part. These strategies have been tested and proven, and they are great for anybody who wants to scalp: beginner or expert. For individuals seeking to acquire market expertise or those just starting with scalping trading, the One-Minute approach is an excellent method to get started. The One-Minute method is one of the most basic yet effective and straightforward to use. Each trade only takes a few seconds to complete, making it very simple and quick to execute. The name implies that the One-Minute technique utilizes one-minute (M1) time charts for each transaction, which makes it quick and easy to earn money. Although each trade is completed in such a short period, it is important to remember that this approach will require you to spend several hours daily focusing solely on your trades to realize your desired earnings. This implies that, whether you use a computer, smartphone, tablet, or a combination of the three, you will need to spend a lot of time keeping an eye on your trading tools. If you are new to scalping, one-minute method trades, one of the most fundamental scalping strategies available, are a great place to start. They are a great strategy for those with experience because they are straightforward and yield quick returns. It is ideal to employ this method when the market is at its peak volatility, typically around the time the New York and London markets close and open. When a particular set of criteria are met, you must place a long order, earn a few pips, then close your position with a short order at precisely the right moment. Quantity is the most essential aspect of the One-Minute method. It is not uncommon for traders to make more than 100 transactions each day to attain their desired daily revenue. Because this approach is so quick, you would not experience any significant gains or losses from your trades, resulting in a much lower risk level than you would with regular trading methods. For this technique, you will be using two different sets of indicators. The first indicator you will use is the “Exponential Moving Average'' (EMA), which you will have set at a period of 50 and a period of 100. Second, you will use the Stochastic Oscillator. For this one, you will need to adjust for time frames of 5, 3, and 3 periods. It is critical that you configure these indicators correctly and keep an eye on them since they are key signals that tell you when to open a long (purchase) order and when to open a short (sell) order. When the market is in ideal conditions, long-order entry positions must be taken. Before starting a long trade, you will want to ensure your EMA's are aligned correctly. The 50 period EMA should rise above the 100-period EMA before you consider putting up a long trade. Furthermore, you should see the Stochastic Oscillator cross above 20 from below, indicating that the market is recovering after being depressed. It is safe to fill out your long order form once these criteria have been satisfied. Short-order entry opportunities almost always need requirements that are the polar opposite of those required for long-order entry positions. For this method, you will want to view the 50-period EMA falling below the 100-period EMA before placing your short order. The Stochastic Oscillator should ideally fall beneath the 80 (overbought) level from above. You may enter the market with short orders once you see these indications.
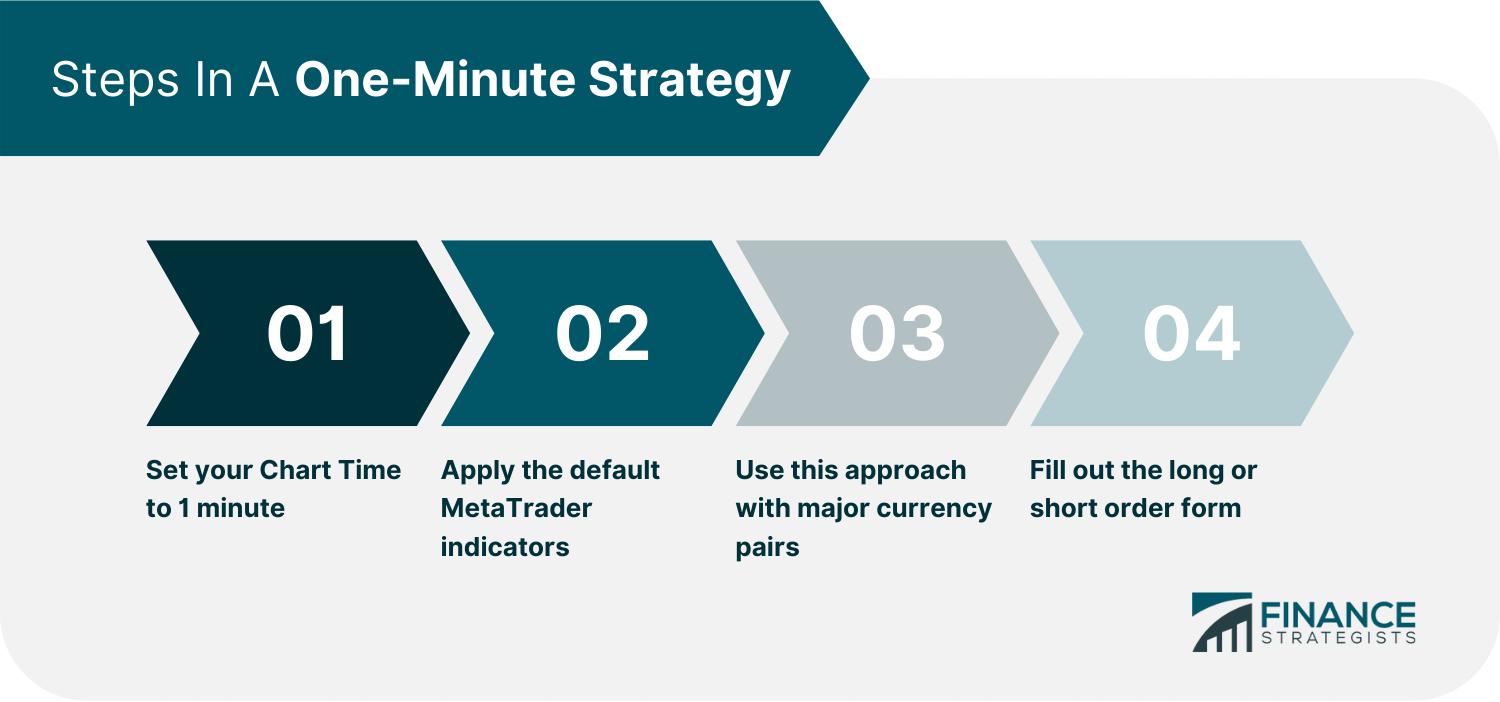
Start by setting your Chart Time to 1 minute. Then, open a secondary chart and set it to 5 minutes so you can get an idea of market trends and notice any signals that may pop up. 1. You will also want to double-check that you have applied the following default MetaTrader 4 indicators to your chart at the right times: 2. You can pick any currency pair you want, but it is advisable to use this approach with major currency pairs if you are a beginner. This is because they have the smallest spreads available, which makes it simpler to use this strategy. 3. To place an order, fill out the long order (purchasing) form: 4. To fill out short-order forms: The Meta Scalper strategy is an excellent method for traders with some experience with scalping. It works by entering and exiting trades on the short waves when the market becomes peak overbought or oversold. You can use this strategy in any market, but it is best to stick to range-bound needs to minimize risk. Even though Meta Scalper is not high yielding, it can still give traders steady profits if used correctly because it has small yet consistent results. This technique is most successful on one-minute and five-minute timeframes; however, it may be fine-tuned to operate on longer periods if necessary. The Meta Scalper uses indicator triggers and price action at each bar (candle) to determine the best entry locations for each long and short order. To produce a scalping sequence, it is critical to spread the risk across many trades. This "averaging out" method is important in limiting drawdowns and generating cumulative profits. Due to its multilateral exposure, the effect of drawdowns on account balances is constrained. While many scalping methods would terminate a trade if it goes into deficit, this technique allows for drawdowns and losses. It requires trades to go into a loss for it to work; as a result, using this approach with active leverage is not advised. The only indicator used in this strategy is the Bollinger band lines. Before we continue, here is a quick explanation of what that is for those who are unfamiliar. The Bollinger band lines are made up of three different indicators, each used to obtain information about the market's current condition. These indicators show the market's trend, volatility, and high and low price anomalies. Three separate bars are used to show this data: the central moving average (main/middle line), the outer bands (upper and lower lines), and the bandwidth (space between the bands). The central moving average is the line used to display the average movement of the market price. This line displays a smoothed version of the market price, which reflects the current average instead of each price change. It helps decipher the general directional trend of the market. The "period" is the averaging window—for example, a twenty-period main line averages over the previous twenty bars (candles) in the chart. Using a higher number for your period means this line will show less detail because it will be averaged over more price changes. The upper and lower bands, as shown by the outer lines in this indicator, elaborate on the concept of the moving average. These bands run equally from both sides of the main line, always staying an equivalent distance apart from each other. The space between the main line and either band is called “standard deviation.” They work with bandwidth to show how much prices fluctuate from their averages, meaning that these lines display market highs and lows extremities. The bandwidth is the distance between the upper and lower bands and is used to quantify market volatility. The wider the bandwidth is, the more chaotic the market's price action is. The standard deviation measures the space between the upper and lower bands or the sum of the standard deviation. This part of the indicator can be used to spot fluctuations in market volatility when they occur. You can use the price bars and lower Bollinger band line to help you decide when to open a long order form. The first condition necessary for opening a long order is met when the bars meet the lower band line. Before opening it, you will also want to see the bars move back toward the main line. This shows that there is a brief pullback taking place after a short-term market peak overbought state. Before you open a short order form, make sure to observe the Bollinger band lines. For this action, you are looking for the opposite of what happened when you opened your long order form. First, see if the bars meet the upper band line; then, they should go back towards the main line. If this happens, then proceed to open a short order form.
6. To create short order (selling) forms: The Moving Average Convergence Divergence (MACD) Indicator strategy has the potential to achieve over 80% in winning trades if used correctly. Many traders overlook this indicator because they do not recognize its usefulness, making it one of the most underappreciated indicators in trading systems. If you get good at it, you will consider it one of the most reliable indicators available if utilized appropriately. This part will explain what it is for and how to use it to maximize your profits. Gerald Appel created the MACD indicator. The indicator is made up of two moving averages and a histogram. The deciphers use two distinct hues: blue for the short-period average and red for the long-term average. The histogram, the blue bars seen beneath the averages, signifies the difference between the two averages. The most important aspect of the histogram is its "zero" level, as it helps show a neutral market. From there, we can tell if the market is on an uptrend or downtrend. The market is on an uptrend when the histogram is above zero and still going up. The histogram is the key component of the MACD indicator. This is where we will pay attention since this is our first indication that the market is in an excellent position to enter. You must understand how to read the histogram, as it will play an essential role in your success with this approach. Scalping earnings may be increased by learning how to use this indicator. The Moving Average Convergence Divergence (MACD) indicator will be your first step in making decisions while scalping. In addition, the Slow Stochastic indicator has two confirmation levels to help you find the perfect entry points. The two designated levels are 80 and 20. Indicating that the market is overbought at level 80 and oversold at 20. When you see your desired trend in the MACD histogram, pay close attention to the Slow Stochastic indicator to make your final decision. Usually, when the Stochastic indicator reaches level 80, it will start declining quickly again., On the other hand, when it plummets down to level 20, we can expect it to spike upwards soon after. The histogram should be well above zero before placing a big purchase. The first thing you will want to do is look for the histogram to begin inclining. But it should then start falling back towards zero. However, before it reaches zero, it should resume increasing upwards. This pattern indicates that the market is on a sturdy uptrend, so you should get ready to put your specific long order (purchasing) entry position together early. It would help if you waited to place a short order until the histogram was well below zero. Then, you want to see it start rising back up towards zero. It should begin declining again when it nears zero, indicating that the market is on a reliable downtrend. During these downtrends, you will want to consider yourself in an order entry position. To submit a long order (buying) form: The MACD Indicator strategy can be used to begin trading. To do this, you need to pay attention to the MACD histogram and look for the following trend: 1. First, the histogram should reach a high level above zero. Then, it should start declining but turn around and start increasing again. This is when you should take careful notice, as it is the first step in determining your long-order entry position. The two lines crossing each other and traveling upwards is another good sign that you are almost ready to enter the market. To create short order (selling) forms: 1. The MACD histogram is an excellent place to begin when entering short (selling) trades, just as when placing long ones. However, unlike the last time, before you start thinking about an entry point, you should check out the histogram below zero level. The Forex market is always moving, so this scalping strategy will help you focus on entering trades during the stronger short-term trends. To succeed with this strategy, it is essential to stay relaxed and make decisions confidently. Making decisions on a short-term basis takes some practice, as there is far less information accessible over a brief period than there is over a longer one. Keep in mind that you do not have to act immediately if you are unsure about an entry choice. It is better to put up with a loss than take it when you were unconfident in your decision to enter because you did not wait until you knew more about the market and felt more confident in your decisions before putting in any entry positions. Before deciding to go ahead with this approach, take a look at hourly charts. The hourly chart will be an essential technical analysis technique for this strategy, so ensure you learn how to use it. You will use two Exponential Moving Average (EMA) indicators while scouting the hourly trend to get more information about the current market. The Slow Moving 34 speed and Fast Moving 8 speed EMA's work best for detecting these trends, so you should use them on your hourly chart. To continue with your trades safely, carefully look for certain market trends that are explained more below. Searching for the strongest trends will help you execute trades at the ideal time while reducing the risks of loss exposure. You will need an hourly chart for your technical analysis, which should be equipped with 8- and 34 period EMA indicators. In addition, you will have a 5-minute chart open to conduct each trade. On this one, you will only use the 8 period EMA indicator - the 34 period EMA will not be needed here. The 8 period EMA indicator and price bars will help you determine your exact entry points for long and short orders. Use the following trend from the hourly chart to open a long order form: when the 8-period exponential moving average line (EMA) crosses over 34 EMA, and the market price is above both, look to the 5-minute chart. On the 5-minute chart, look for the price to reach over the 8-period EMA line. When this occurs, you are ready to complete a long purchase form. You may open additional orders whenever the price crosses the 8-period EMA line on the 5-minute chart. This is one of the strategy's customizable elements, allowing you to increase your exposure. Use stop losses and take profits to minimize any significant losses when opening orders. When looking for short order entry conditions, you will be searching for the exact opposite indicators as you were when placing long order entries. The 8-period EMA must drop below the 34-period EMA, and the price should fall below both. On the 5-minute chart, you will want to see the price drop below the 8-period EMA line before looking for your exact short order entry position. You should look for a decline in price below the 8-period EMA line on this chart. After you have found it, you can start filling out your short order entry form. When the price falls beneath the 8-period EMA, you may add additional short orders if necessary. As previously stated, always utilize stop-losses and take profits to avoid significant losses with your trades. 1. To start, open an hourly chart time. Then, you will use the Exponential Moving Average (EMA) indicator for both a Fast Moving Average 8 period and a Slow Moving Average 34 period. 2. Then, open a 5-minute time chart. On this chart, you will use an 8-period EMA as well. Because of the shorter period, this one will not need the 34-period EMA. 3. To submit long order (purchasing) forms: 4. To place a small order: Scalping in the Options market is quite different from scalping in the forex market. Although both strategies share the same goal, the markets work very differently. In Forex, trades are completed immediately, while Option trades take longer to process because each time a contract is opened (this can be done with a call or put), it gives you the right to buy or sell an underlying asset at a specific price on or before a specified date. Please note that it is a right to buy and sell the underlying asset, not an obligation. You can choose to abandon the contract if you desire, without acting on it. However, if the conditions are right and you wish to, you can proceed with purchasing and fulfill the contract. This contract must be fulfilled within a set amount of time, as options contracts can expire, thus turning them invalid. Also, unlike Forex, the options market closes and opens, so you will be required to wait for the market to open in the morning before you can start any trades. Gamma scalping aims to make enough money from each trade to offset the position's time decay or "theta." To do this, traders adjust the deltas of a long option premium and long gamma portfolio of options. Trades are conducted quicker than usual to take advantage of small price changes. Gamma scalping is an options trading strategy that does not focus on market direction. Even if the market moves up and down, you can still make a profit as a trader with this technique. Some people might not be interested in this strategy, but everyone needs to understand it nonetheless. The significance of grasping this mechanism is that gamma scalping is a key element in the machine that calculates market volatility. It still has the potential to be extremely lucrative if users learn how to use it correctly. This method works best for individuals who are experienced with the trading markets and have a lot of knowledge, but anybody willing to study can master it. To comprehend how options traders utilize "the greeks" to trade, you must first understand how they do so. The terms used to quantify the effect of different option values on an underlying asset's price are called the greeks. These metrics convey necessary information about factors such as time, market volatility, and asset prices. Each influence has its own metric, which is named after a letter in the Greek alphabet; this is where the term “the greeks” comes from. The metrics you will need to familiarize yourself with for this method are delta, gamma, theta, and vega. Each will be explained in detail below, and examples will be provided to solidify your understanding. The indicators you should pay attention to for this technique are relevant to all option-based trades. Because they may be somewhat perplexing, especially for someone unfamiliar with what they are looking at, some additional information and examples of each metric below have been included below. The delta metric refers to the option value's rate of change in response to a variation in the underlying asset, with shares being bought and sold. Deltas are represented as perfect integers and recorded in decimal form. Positive deltas are associated with calls (the option to purchase), whereas negative deltas are associated with puts (the option to sell). For example, if an options delta is 0.40, it implies the underlying stock moves 40% as much as it does. The 0.40 delta will rise by 40 cents if the value increases by one dollar. Your delta represents how many shares you have the right to in the underlying stock. Assume you own a call with a 0.40 delta; this means it will move 40% as much as the actual stock when put into action. It also implies that you get to trade 100 shares of the actual stock you are trading in for each share of your option contract. The term "at-the-money" refers to a scenario in which both the call and put options are at the money, or about a 0.50 delta (50%). The terms "in-the-money" and "out-of-the-money" would then refer to how far above or below zero the delta is. If an option is in-the-money, this means that it has a higher delta value than any other amount up to 1.00 (100%). Alternatively, if an option is out of the money, it has a lower delta value than any other amount ranging from 0.50 down to 0 (0 percent). The gamma metric represents how the option deltas change in relation to any changes in the underlying asset. As we explained earlier, more in-the-money options have a larger delta. On the other hand, options that are further out-of-the-money will have a smaller delta. Since stock prices are constantly changing, this means that the option's delta is also continually changing. Sometimes these changes can significantly impact your profit and loss (P&L). This is why it is essential to understand how diversity in the delta affects your P&L – gamma becomes a vital metric to watch when trying to manage your risks effectively. Gamma is calculated similarly to deltas and expresses an option's number of deltas. So, if an options gamma is 0.15, the option will earn 0.15 deltas per one-unit increase of the underlying stock price and lose 0.15 delta with each one-unit decrease of the underlying stock price. Positive gamma is found in long options (both calls and puts). Negative gamma can be found in short options (both calls and puts). Positive gamma helps you make more money on your wins and lose less on your losses than the delta would indicate. Negative gamma has a negative impact on your profits. Theta relates the option's value to any modifications in the time until expiration. The more time goes by, the less an option is worth. As a result, the theta is a metric that indicates how much value an option will lose each day over time. The dollar and cent theta statistic is recorded. Time decay causes options with a theta of 0.07 to lose seven cents daily. Long options have negative theta, meaning they lose value over time. Short options have positive theta, meaning they gain value over time. Theta and gamma are inverses of one another, and they counter each other depending on the parameters of an option. The loss incurred by a negative theta is offset by the benefit received from a long option's positive gamma. Conversely, the profit from a short option's positive theta is offset by the negative gamma. The Vega of an option indicates the changes in the option's value in response to a change in the implied volatility of that option. The volatility component that is built into the price of an options contract is referred to as implied volatility. The option price closely tracks the implied volatility: if the options implied volatility is high, so will the price. However, if the option's implied volatility is low, so will the option's value. Implied volatility may vary over time, and vega measures this degree of variation in option value. Vega is similar to theta in that it is measured in dollars and cents. So, if an option has a vega of 0.03, then it will earn three cents for every one-point increase in implied volatility and lose three cents for every one-point decrease in implied volatility. When you are about to gamma scalp, establishing a delta-neutral trade strategy is a good idea. To do this, simply offset the deltas by selling stock each time you execute an options trade. As a result, if you buy shares in the market, you should sell an equal amount to reduce your position's immediate directional sensitivity. This means that your delta will be close to 0.50, or at-the-money. With the delta readjusting, you now have an opportunity: hedge your investment by taking advantage of how the changing delta affects stocks, which could lead to profiting off quick sales. To hedge your investments means to continue investing in the interest of prior ones, so: 3. You need to be cautious of theta in your scalping plans. Theta is the measure of money a stock loses every day. To negate this loss, you will have to scalp more than the cost of theta. (To put it simply, if the theta cost for one call is $0.04 and you have 100 contracts, that is $4 per day or $400 total cash flow lost each day. You would need to make more profit than the net amount lost from the theta each day to see any profits.) Theta is a metric that measures implied volatility-- In other words, if an option's theta is high, you will need to scalp more trades to turn a profit and cover the higher theta value. Contrarily, If an options theta is low, then you will not need to trade as frequently to make back what you put in plus interest. Keep this tip in mind before placing any trades so that it can help maximize your earning potential. Averaging Out: This strategy aims to manage risk by investing smaller sums into a more significant number of less expensive stocks rather than putting all your eggs in one basket with one large stock purchase. Bars (AKA Candlesticks): These bar graphs show the current market price. They are constantly changing as the market price changes. Bollinger Band: A volatility indicator comprising three primary lines and using three distinct signal methods to convey market information. The moving average, the middle line, and the bandwidth (between upper and lower band lines) represent the current volatility of the markets. Exponential Moving Average (EMA): A type of moving average that gives more weight to the most recent data than other moving averages do. This sort of moving average reacts far quicker to recent price changes than others, such as a simple moving average. The Greeks: The current market action in options trading is determined by metrics called "The Greeks." The Greeks include delta, gamma, theta, and vega. Each Greek represents a specific market aspect and acts as an indicator in the options market relevant to every trade. You do not need to take any special measures to implement them - they simply exist. Long Order: The order that corresponds to a trade's purchase process. They are placed before short orders. Moving Average: A technical analysis method that smooths out price fluctuations. This form of indicator has a line that follows the market's general trend without the dramatic swings in price seen in the bars. Moving Average Convergence Divergence: This trading indicator is used to track changes in the strength, direction, momentum, and duration of a stock's price trend. Range Bound: A strategy that involves finding stocks trading in channels and using those to make buy/sell decisions. Technical analysis allows you to locate potential support and resistance levels, which a trend trader can then use to their advantage by buying a stock at the bottom of the channel (lower level of support) and selling near the top of the channel (resistance). Short Order: The process of selling a trade. Short orders are placed after long orders and, in this case, complete the scalping process, resulting in profit for the trader. Stochastic Oscillators: These are momentum indicators that utilize support and resistance levels as a type of technical analysis. The term stochastic refers to the current market price's position in relation to its range over a given length of time, while the word oscillator refers to a device for displaying market momentum and direction based on its recent history. Stop-Loss: A trade order that is opened at the same time as a long or short order to reduce the danger of losses associated with a trade. For example, if your stock is worth $50 and you set a stop loss at $49, then if the market value drops to $49, the stop loss will activate a sale at the next available market price. If this is $48.80, for example, your stock will sell for $48.80. Take-Profit: Take-profit is an order that is opened at the same time as a long or short order. It's used to make sure you sell in the other direction, making a profit instead of having the market value drop and losing your investment. For instance, if you buy a stock for $50 and set a take-profit at $55, your trade will automatically be sold when the market value hits $55. If the next available price is $55.10, your stock will sell for that amount. Take-profits can also be individualized profit goals for each trade. What Is Scalping?
Although some might say that these systems make trading less accurate as they sometimes overlook things humans would catch, they are helpful overall.Advantages and Disadvantages of Scalping
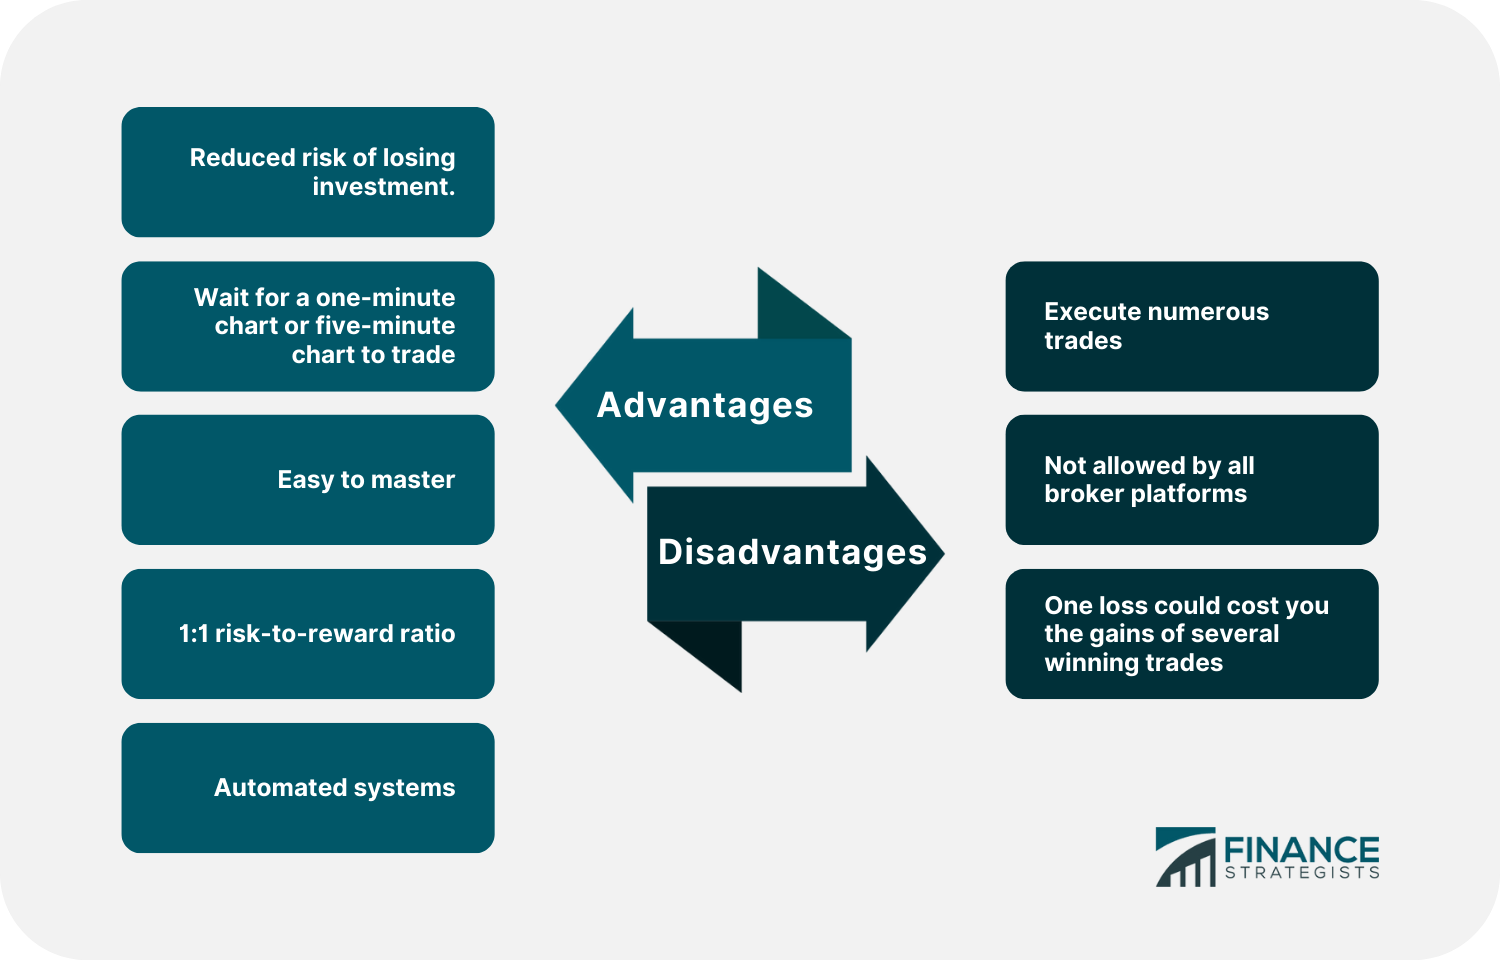
Advantages
In some cases, fifteen-minute charts are used; however, this article will focus on shorter time intervals of up to five minutes.
This may be a disadvantage for seasoned traders who are used to the market as your current abilities may not apply when it comes to scalping.
However, you should be happy to learn that the skills that scalping provides can be quite easy to master, even more so if you already understand how the market works.
Plus, you may customize the system to utilize any strategy you choose, ensuring it has a high probability of success before putting it into your automated trading system.Disadvantages
Several unique strategies can be implemented, five of which we will discuss here, that can significantly increase your chances of success with this technique. About Forex
The One-Minute Strategy
Each stage must be completed when the situation permits to avoid incurring any losses on your gains.Indicators Utilized
The Long Order (Purchasing) Entry Overview
Overview of the Short Order (Selling) Entry:
Steps to Follow
Tips
These secondary charts can help you understand current market conditions better and determine when to enter market position openings since they provide more in-depth information about the current market environment.
The Meta Scalper
Indicators Utilized
Overview of Long Order (Purchasing) Entry
Overview of Short Order (Selling) Entry
Steps to Follow
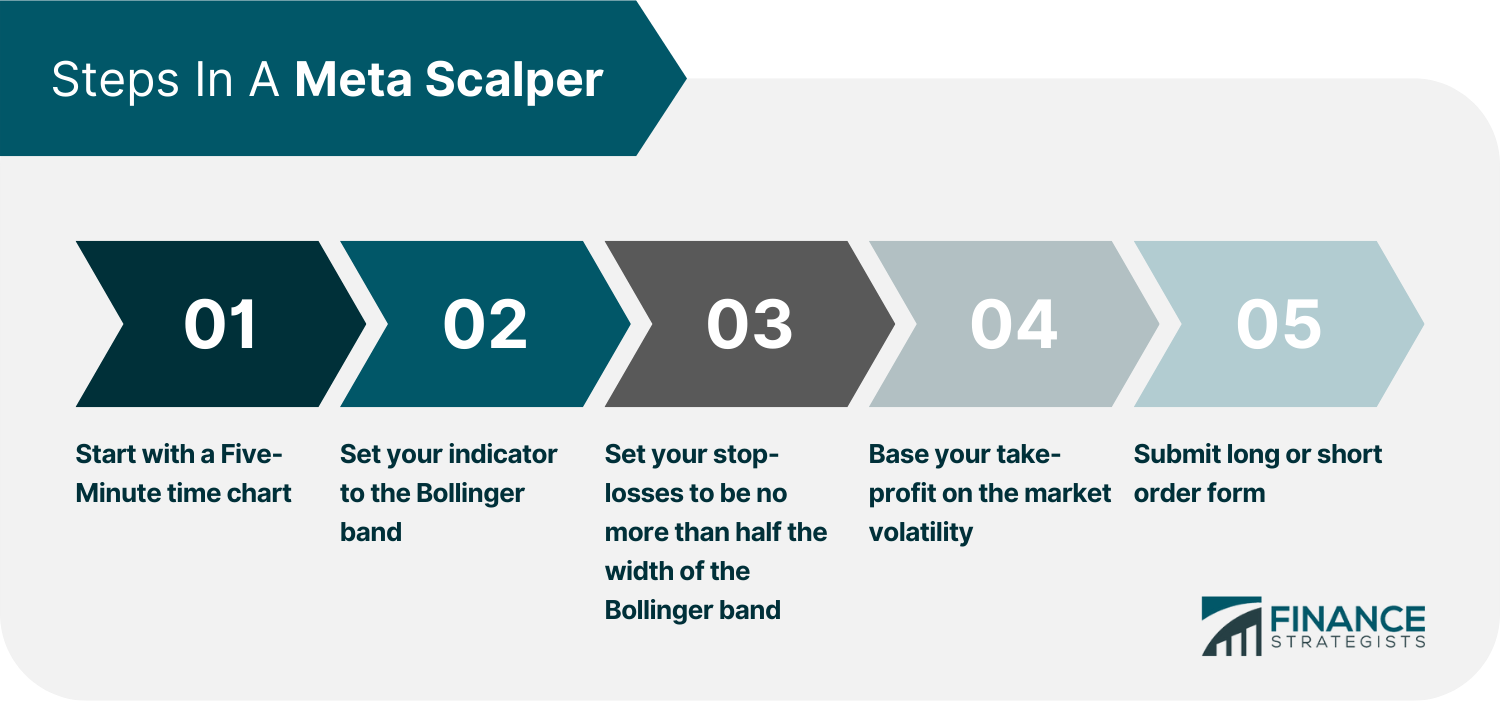
1. If you are new to this strategy or scalping in general, starting with a Five-Minute time chart may be best. However, using a One-Minute or Five Minute time chart works just as well.
2. Set your indicator to the Bollinger band. Because the Bollinger band indicator is somewhat delayed and may stifle the accuracy of your trades if used alone, you will also want to use real-time input.
Real-time indicators will assist you in determining whether or not it is a good idea to enter the market.3. When opening orders, set your stop-losses to be no more than half the width of the Bollinger band. This implies that if the total bandwidth is 20 pips, you should place the stop-loss at 10 pips.
4. You will base your take-profit on the market volatility, which is generally 5% of the total bandwidth. This is typically 1-6 pips, but it can differ based on how volatile the market is, so use your best judgment.
5. To submit a long order (buying) form:
Tips
A secondary chart with these indicators and a longer time frame opened might assist you in confirming that the current market price is operating as expected.
Moving Average Convergence Divergence (MACD) Indicator
The MACD indicator is a straightforward one to understand and may be quite useful when scalping.
In contrast, when it falls below zero and continues downwards, the market must be in a downtrend.Indicators Utilized
An Overview of The Long Order (Purchasing) Entry
An Overview of The Short Order (Selling) Entry
Steps to Follow
2. Compare your histogram trend to the above criteria. If it matches, examine the Stochastic indicator to see where it is positioned. You want it in the oversold area (approximately level 20) before you make a trade.
1. Once you have found the right moment, you can execute your trade by watching for these conditions:
The histogram should rise again, and the Stochastic indicator goes down into oversold territory. After that, wait for the candle that created this condition to close so you can make your move.2. Once you have entered the trade, place your stop-losses.
Place stop-losses 1 pip below the base candlestick, where all of the criteria were met, and the trade was initiated, for long orders.
The final 20% of your position will be closed in two stages: initially 80%, then lastly 20%. Here is how it should be done:
Your second profit target should also be double what it was for the first 80%, so if your original take-profit goal was 25 pips, now aim for 50 pips. Once this amount has been reached, you can close out the rest of your trade.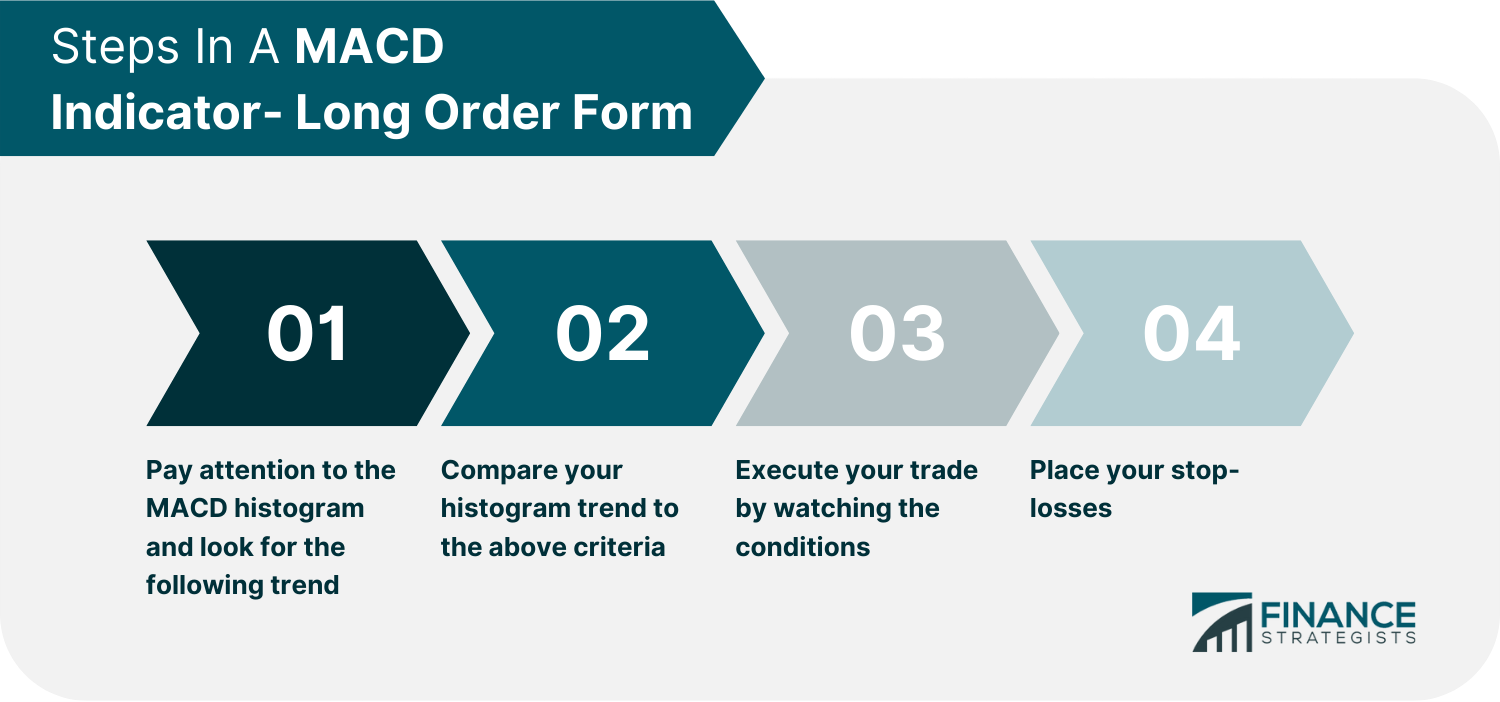
When the blue bars fall below zero level, wait for them to rise back up before making a move. They should then go down again, indicating that the market is on a trustworthy decline. This will be your first indication that you may enter a short order.
2. Once the MACD histogram trend is appropriate, study the Stochastic indicator to determine what it is up to. The indicator should reach the overbought region, around level 80, for short orders.
3. When these two lines crossover and begin to head downward, you are almost ready to start your short trade entry.
When the histogram falls again, you will know where to place your entry point. Once that happens, and the Stochastic reaches the overbought region, you should wait for the candle that established this situation to close.
You may then enter the market with a short trade once it has closed.
4. Once you have initiated the trade, you will want to add the spread to your stop-loss in a short trade. So, place the stop-loss 1 pip above the high of your base candlestick (the one where all conditions were met and you entered).
5. You will close your trade in two parts: the first 80% and then the remaining 20%.
Then, change your taken-profit goal; it should be double the previous goal. So, if your first goal is 25 pips, make this one 50 pips. Once reached, close the final 20% of our current trade.Tips
If the market trend lasts only for one bar before returning below zero level again, you can safely enter into a short-order trade.
Be aware that this cross must last for only one bar in either trade scenario; if it lasts two or more bars, then the market trends become unreliable and may result in losses instead of gains.
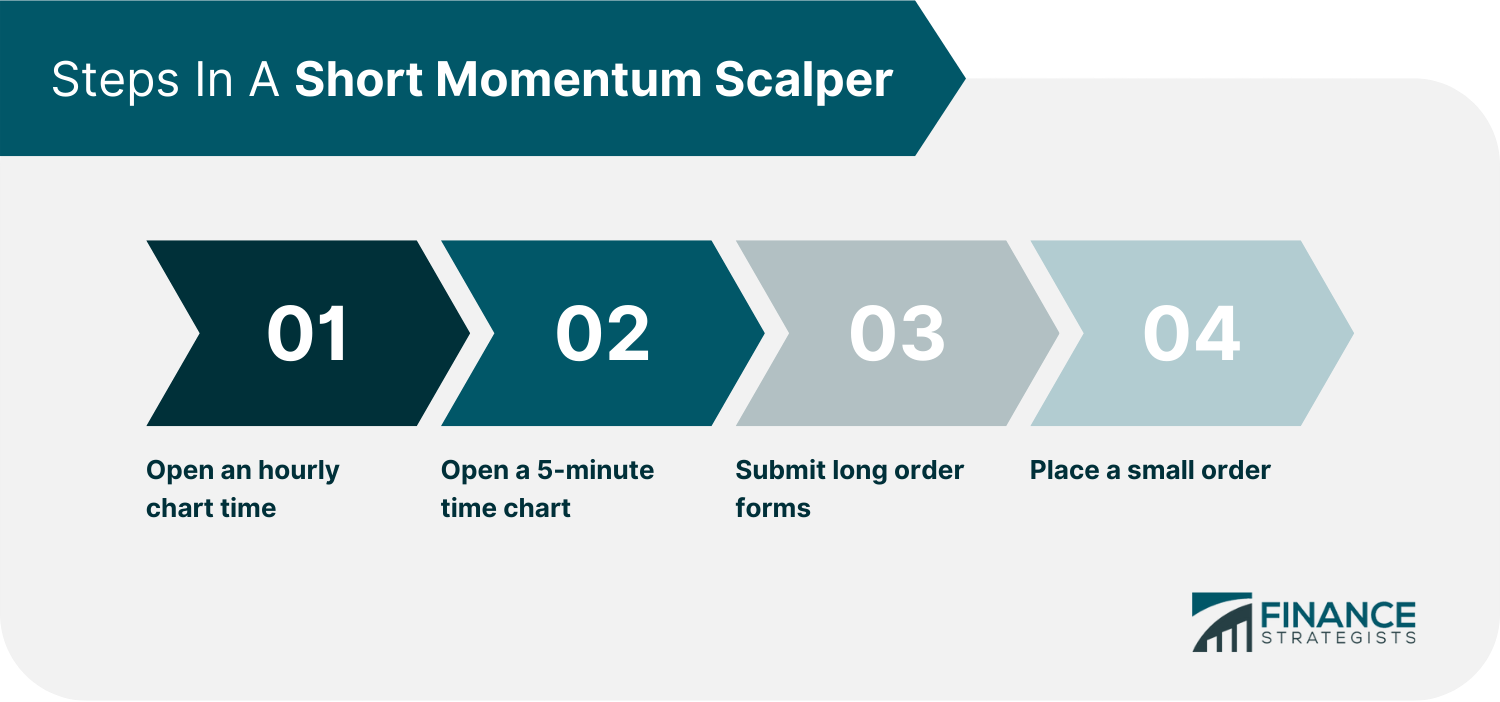
The Short Momentum Scalper
Indicators Utilized
An Overview of the Long Order (Purchasing) Entry
Short Order (Selling) Entry Overview
Steps to Follow
Tips
Options Market
Gamma Scalping
Indicators Utilized
Delta
Gamma
Theta
Vega
Overview of the Entry
Steps to Follow
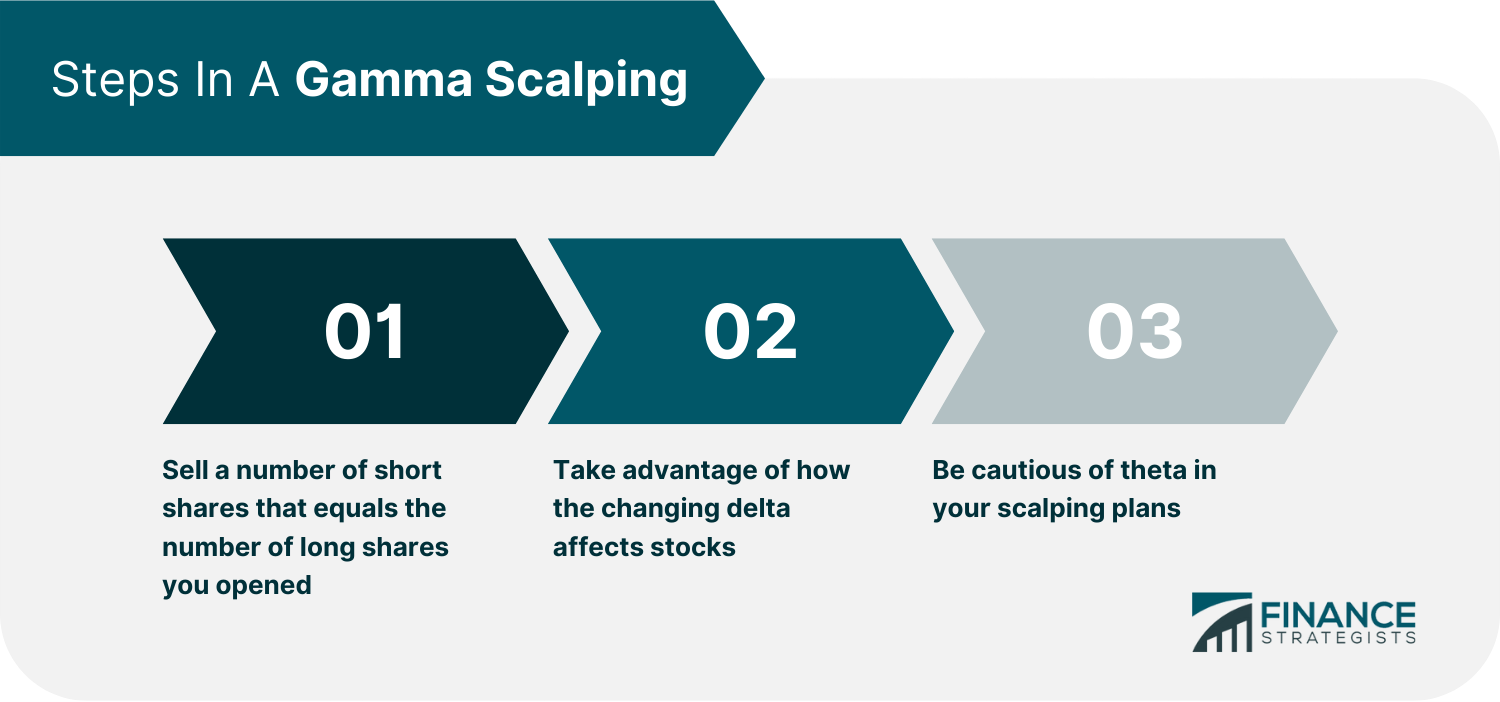
1. To set up a delta-neutral position, you want to sell a number of short shares that equals the number of long shares you opened.
For example, if you buy 100 ABC calls, each has 0.40 delta, your total position delta would be 40 - the equivalent of 4000 shares (delta x number).
2. As the stock's price increases and decreases, so will your gamma. Your trade will be improved due to the gamma, and the delta will change to work in your favor. The delta will get smaller as your underlying stock falls and longer as it rises.
Glossary of Terms
Scalping FAQs
Scalping is a trading strategy that involves holding a position for a short period of time and selling it as soon as the market price changes in your favor. This is done in an attempt to make small profits that can add up over time. Scalpers typically trade with very tight stop-losses and take-profits, and they may enter and exit the market multiple times throughout the day.
There are many scalping strategies, but some common ones include range bound trading, moving average convergence divergence (MACD) trading, and stochastic oscillator trading.
That depends on your trading goals and style. Scalping can be a very profitable strategy, but it requires a lot of time and dedication. If you're not willing to put in the effort, then scalping may not be right for you.
As with any trading strategy, there are risks associated with scalping. Because scalpers typically trade with very tight stop-losses, a small move in the market can quickly result in a loss. Additionally, scalpers need to be constantly monitoring the market for opportunities, which can be mentally and emotionally draining.
The best way to know if scalping is right for you is to test it out with a demo account. This will allow you to see if you're able to handle the fast-paced nature of the strategy and if it aligns with your trading goals.
True Tamplin is a published author, public speaker, CEO of UpDigital, and founder of Finance Strategists.
True is a Certified Educator in Personal Finance (CEPF®), author of The Handy Financial Ratios Guide, a member of the Society for Advancing Business Editing and Writing, contributes to his financial education site, Finance Strategists, and has spoken to various financial communities such as the CFA Institute, as well as university students like his Alma mater, Biola University, where he received a bachelor of science in business and data analytics.
To learn more about True, visit his personal website or view his author profiles on Amazon, Nasdaq and Forbes.