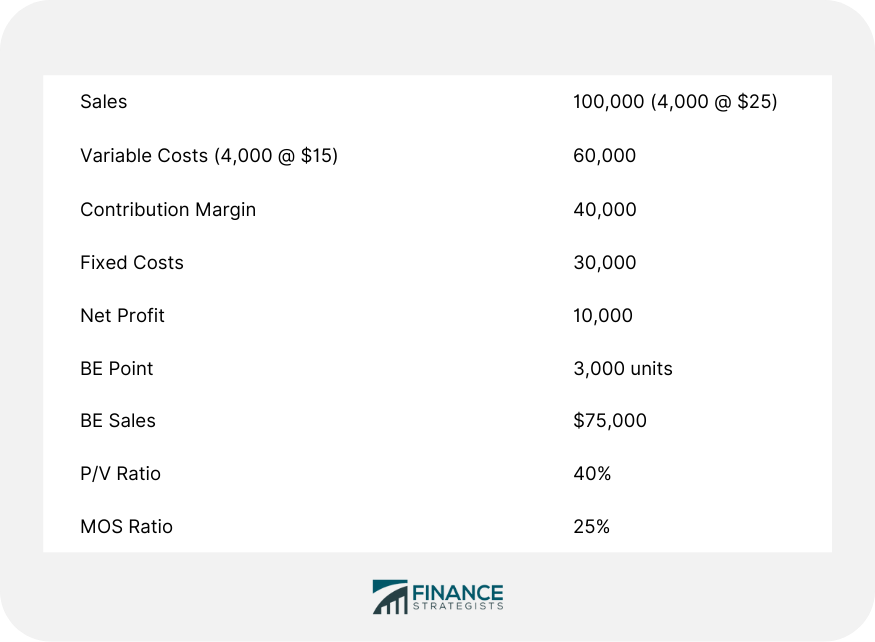
Managers find information concerning cost-volume-profit (CVP) relationships useful because it helps in various planning decisions. Managers use this analytical technique to achieve far more than simply identifying break-even points. The following problems are based on the information given for Company X: 1. A 10% reduction in selling price per unit New SP per unit = 25 - (25 x 10%) = $22.50 New contribution margin per unit = 22.50 - 15 = $7.50 With fixed costs remaining unchanged, the new break-even point is 30,000 / 7.5 = 4,000 units. The management may find the proposed changes desirable if, in the long run, sales are expected to increase. 2. The management believes that with a 10% reduction in selling price per unit, demand is expected to increase by 25%. What effect would this change have on profits? Is this a viable proposition? Consider the following situation: The proposed change is not desirable. This is because net profits have decreased by $2,500. Also, the break-even point has increased to 4,000 units and both the P/V ratio and MOS ratio have fallen. These examples serve to show that CVP analysis is helpful to solve various business problems. It is a powerful tool to use in conjunction with variable costing in order to improve the decision-making process.Example
Solution

With a reduction in sales price per unit and an increase in sales by 25%, the relevant calculations are shown below:
A Different Situation
Applications of Cost-Volume Profit (CVP) Analysis FAQs
CVP analysis calculates the total revenue required to cover expected costs. Breakeven analysis determines when revenues equal expenses.
Common uses include serving as input for pricing decisions, tracking results over time, predicting Cash Flow and evaluating investment options, making decisions about mergers or acquisitions, and fulfilling reporting requirements for investors.
This analysis only works under very specific assumptions about costs, volume and selling price. Furthermore, it assumes that there is no difference between operating income and net income. Finally, the analysis works best for companies with relatively steady revenue streams over time where changes in volume are expected to have a proportional effect on costs.
CVP focuses on units which can be sold like units produced or units sold, while abc focuses on how much of each activity has been done.
One needs to take the fixed costs and divide them by Contribution Margin per unit. Contribution Margin per unit is then multiplied by number of units that need to be sold in order to cover costs.
True Tamplin is a published author, public speaker, CEO of UpDigital, and founder of Finance Strategists.
True is a Certified Educator in Personal Finance (CEPF®), author of The Handy Financial Ratios Guide, a member of the Society for Advancing Business Editing and Writing, contributes to his financial education site, Finance Strategists, and has spoken to various financial communities such as the CFA Institute, as well as university students like his Alma mater, Biola University, where he received a bachelor of science in business and data analytics.
To learn more about True, visit his personal website or view his author profiles on Amazon, Nasdaq and Forbes.


