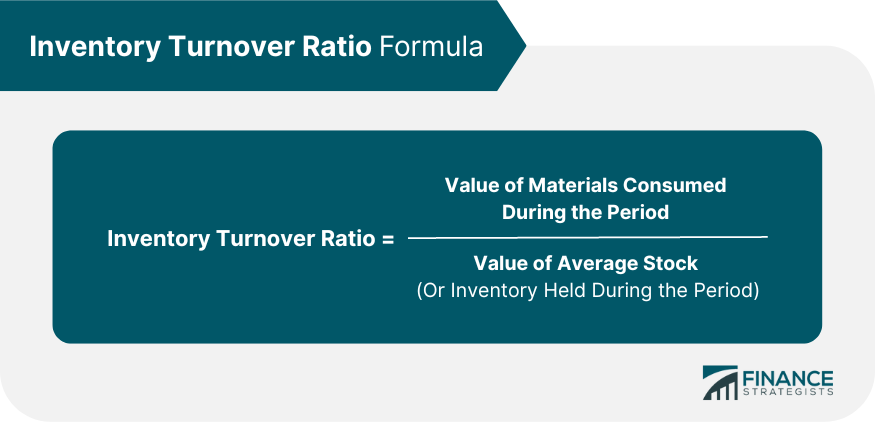
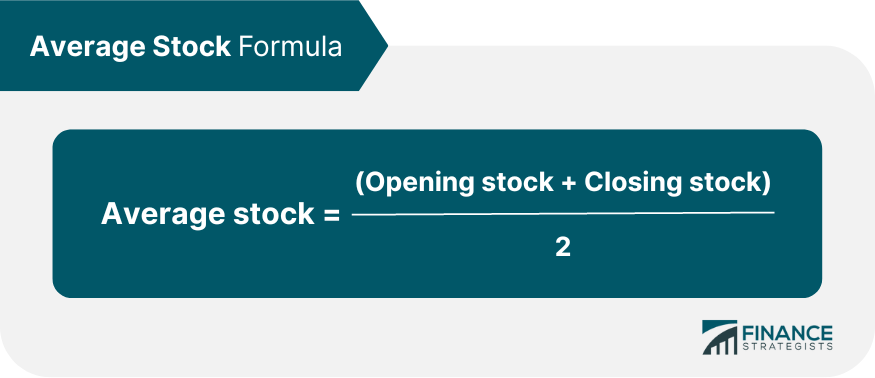
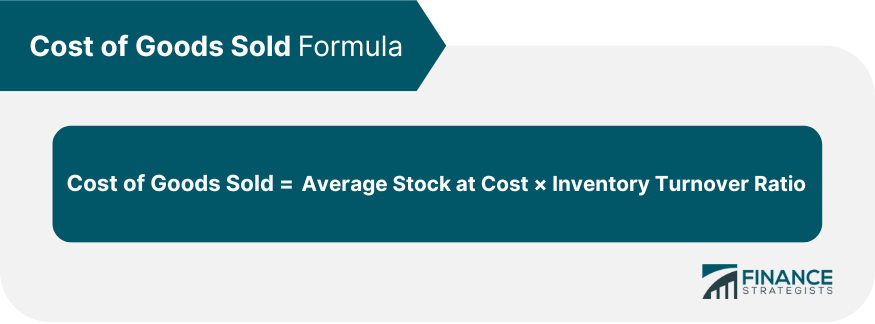
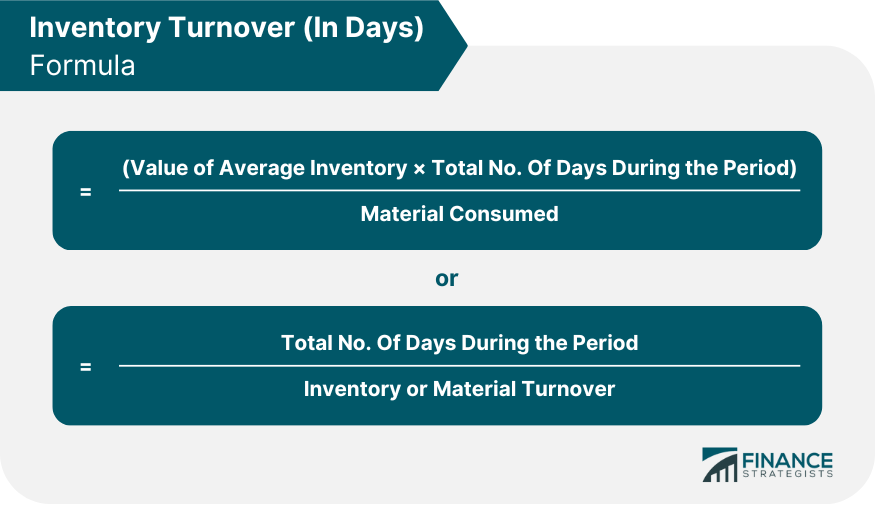
Inventory turnover is the rate at which a company sells its inventory. As such, inventory turnover refers to the movement of materials into and out of an organization. It is in the best interest of the organization to compare the turnover of different types of (and grades of) material as a measure of detecting stock that does not move regularly. In this way, capital investment can be minimized in undesirable stock. The inventory turnover ratio can be calculated by comparing the balance of stores with total issues or withdrawals over a particular period. The inventory/material turnover ratio (also known as the stock turnover ratio or rate of stock turnover) is the number of times a company turns over its average stock in a year. It shows how fast the stock moves in and out of the company. The inventory turnover ratio is arrived at using the following formula: Inventory turnover ratio = Value of materials consumed during the period / Value of average stock (or inventory held during the period) Average stock = (Opening stock + Closing stock) / 2 On the other hand, a low inventory turnover ratio in relation to a particular item indicates its slow movement. As such, it indicates to the organization that over-stocking should be avoided for that item and, in certain cases, that immediate disposal is the best option. If the average stock and inventory/material turnover ratio are known, it is possible to calculate the cost of goods sold. To do this, you can use the following formula: Cost of goods sold = Average stock at cost × Inventory turnover ratio A high inventory/material turnover ratio reflects the company's efficiency in the use of its funds invested in the stock. However, it is also associated with several limitations. For example, a high inventory/material turnover ratio may lead to frequent stock-outs, the inability to provide adequate choices to customers, or a failure to meet sudden increases in demand. Most industries have norms and clear expectations about what constitutes a reasonable rate of stock turnover. For example, certain industries, including the automobile industry, have a very low inventory turnover ratio (e.g., only 3 or 4 times per year). In other words, their average stock is one-third or one-quarter of their annual cost of sales. Other businesses have a much faster inventory turnover ratio, examples of which include petroleum companies. These organizations may carry stock of no more than three days requirements at any given time. The reason for this is simple: these companies can maintain an efficient system of distribution and receive stock replenishments on a daily basis (or even several times a day). Consequently, they can meet customer needs without having to hold large stocks. Oftentimes, each industry will have an acceptable average inventory turnover ratio. Most businesses operating in a specific industry typically try to stay as close as possible to the industry average. Inventory turnover indicating slow-moving items can be classified into the following three categories: These indicate the items that exhaust at a very slow speed. It is important to minimize the stock of such items in the store. Such materials do not have any demand at present and represent a zero turnover ratio. Stock of this kind may regain demand in the future. Therefore, storekeepers and other officials should deliberate on whether to retain or dispose of such items in order to save further storing or handling costs. Such material items are no longer in demand and represent a zero turnover ratio. Obsolete items should be immediately scrapped or discarded and the profit or loss should be transferred to the costing profit and loss account. John Trading Concern has provided you with the following data for the year 2016: Required: Calculate and interpret the company's inventory/material turnover ratio (i.e., rate of stock turnover or stock turnover ratio). Before calculating the inventory turnover ratio, we need to compute the average stock and cost of sales. Average stock can be calculated as follows: Average stock = (Opening stock + Closing stock) / 2
= ($570,000 + $630,000) / 2
= $600,000 In addition, cost of sales is determined as outlined here: Cost of sales = Opening stock + Purchases - Closing stock
= $570,000 + $3,660,000 - $630,000
= $3,600,000 Having calculated the average stock and cost of sales, the inventory or material turnover ratio can be determined as follows: Inventory or material turnover ratio = $3,600,000 / $600,000
= 6 times a year (or once every 2 months) For a trading concern, an inventory/material turnover ratio of 6 times a year is not very high. One would expect a trading company to have a faster rate of stock turnover. However, it is difficult to pass judgment without knowing the exact type of goods that John Trading Concern is dealing in, as well as the norms prevailing in the market for those types of goods. This emphasizes the importance of knowing the industry average. It plays a key role in enabling managers to truly appreciate the efficiency (or lack thereof) of their organization's stock management practices. The following figures were taken from the books of John (Pvt) Ltd. for the year ending 31 March 2019. The valuation of the inventory is $1 per kg. (for Materials X and Z) or $1 per liter (for Material Y). First of all, the cost of materials consumed pertaining to each item must be calculated: Materials consumed = Opening stock + Purchases - Closing stock Consumption of X = 700 + 11,500 - 200 = 12,000 kg. Consumption of Y = 200 + 11,000 - 1,200 = 10,000 liters Consumption of Z = 1,000 + 1,800 - 1,2000 = 1,600 kg. Next, we need to calculate the average inventory of each material item, which can be done as follows: Average inventory = (Opening stock + Closing stock) / 2 Average inventory of X = (700 + 2000) / 2 = 450 kg. Average inventory of Y = (200 + 1,200) / 2 = 700 liters Average inventory of Z = (1,000 + 1,200) / 2 = 1,100 kg. In turn, we can calculate the inventory/material turnover ratio as follows: Inventory/material turnover ratio = Value of materials consumed during the period / Value of average inventory held during the period Thus, the inventory/material turnover ratios of the three materials are: Material X = 12,000 / 450 = 26.67 times Material Y = 10,000 / 700 = 14.29 times Material Z = 1,600 / 1,100 = 1.45 times The inventory turnover, as expressed in days, can be determined with the following formula: = (Value of average inventory x Total no. of days during the period) / Material consumed or = Total no. of days during the period / Inventory or material turnover Material X = 450 x 365 / 12,000 = 365 / 26.67 = 14 days (approx.) Material Y = 700 x 365 / 10,000 = 365 / 14.29 = 26 days (approx.) Material Z = 1,100 x 365 / 1,600 = 365 / 1.46 = 250 days. In this example, the inventory/material turnover ratio is the highest for material X and the lowest for material Z. Similarly, the consumption rate of material X is greater compared to material Z, which is the lowest (as indicated by the number of days calculated). Therefore, it is suggested that purchases of material Z should be small in quantity. Furthermore, this material should be purchased as and when the need arises. By contrast, frequent purchases are suggested for material X and moderate purchases for material Y. [show_file file="webcalculators/ratios/inventory-turnover-ratio.txt"]What Is Inventory Turnover?
Inventory Turnover RatioFormula to Calculate Inventory Turnover Ratio

Average stock can be calculated by adding opening closing stocks and then dividing by 2. In other words:
The inventory turnover ratio shows which material items are fast-moving, and so it provides valuable information that can guide investments in that item.Calculating Cost of Goods Sold Using Inventory Turnover Ratio

If the average stock of a business is high in relation to its annual sales, its inventory turnover ratio will be low. Similarly, if the average stock is low, the inventory turnover ratio will be high.Classification of Inventory Turnover
1. Slow-Moving Materials
2. Dormant Items
3. Obsolete Items
Example
Solution
Interpretation
Example 2

Required: Calculate the inventory/material turnover ratio of the above material items and express (in terms of the number of days) the length of time for which average inventory is held.Solution

Applying this to the three materials, we have:Interpretation
Inventory Turnover Ratio Calculator
Inventory Turnover Ratio FAQs
Inventory turnover is the rate at which a company sells its inventory. As such, inventory turnover refers to the movement of materials into and out of an organization.
The inventory/material turnover ratio (also known as the stock turnover ratio or rate of stock turnover) is the number of times a company turns over its average stock in a year. It shows how fast the stock moves in and out of the company.
The inventory turnover ratio is arrived at using the following formula: inventory turnover ratio = value of materials consumed during the period / value of average stock (or inventory held during the period) average stock can be calculated by adding opening and closing stocks and then dividing by 2. In other words: average stock = (opening stock + closing stock) / 2
If the average stock and inventory/material turnover ratio are known, it is possible to calculate the cost of goods sold. To do this, you can use the following formula: cost of goods sold = average stock at cost × inventory turnover ratio
Inventory turnover indicating slow-moving items can be classified into the following three categories: 1. Slow-moving materials 2. Dormant items 3. Obsolete items
True Tamplin is a published author, public speaker, CEO of UpDigital, and founder of Finance Strategists.
True is a Certified Educator in Personal Finance (CEPF®), author of The Handy Financial Ratios Guide, a member of the Society for Advancing Business Editing and Writing, contributes to his financial education site, Finance Strategists, and has spoken to various financial communities such as the CFA Institute, as well as university students like his Alma mater, Biola University, where he received a bachelor of science in business and data analytics.
To learn more about True, visit his personal website or view his author profiles on Amazon, Nasdaq and Forbes.


