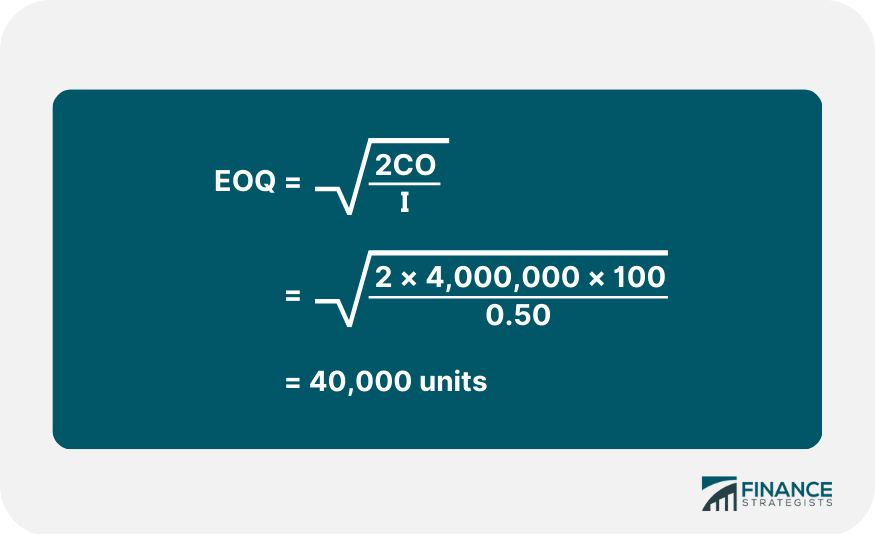
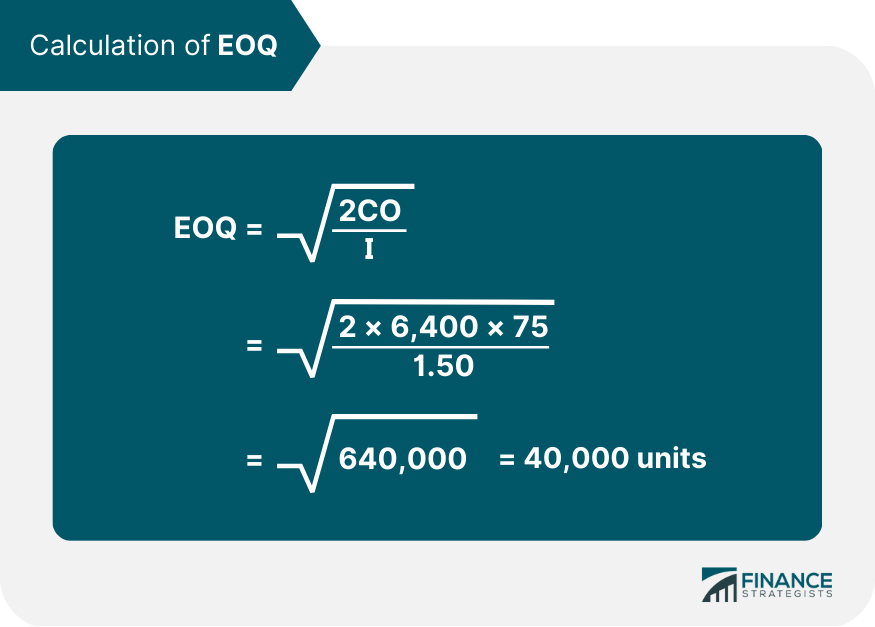
A factory uses a specific raw material. There are also three processes A, B, and C. The data relating to inputs, outputs, and rejections for the month of April are given below. Calculate the cost of raw materials needed to produce one piece of the finished product when: 1. Process If 1,000 pieces is the required output from Process C, the input should be 1,000 plus 20% (i.e., 1,200 pieces). This input of 1,200 units for Process C should be the output of process B. The percentage of rejection, which is 10% in Process B, means that the input in Process B should be 1,200 pieces plus 10% (i.e., 1,320 pieces). Similarly, 1,320 pieces should be outputted by Process A. With a percentage of rejection of 50%, the input of Process A should be 1,320 plus 50% (i.e., 1,980 pieces). This information can be tabulated as follows: 2. Given The weight of the finished product is 10 grams per piece. Assuming that there is no other loss of material, the total material required for 1,980 pieces of input for Process A is the following: 1,980 pcs. x 10 gms. = 19,800 gms. Rate of Material = $1 per kg Cost of raw material = (19,800 x 1) / 1,000 = $19.80 Cost of raw material per pc.= 19.80 / 1,000 = $0.0198 (1) Discuss the consideration that influences the setting of maximum, minimum and reorder stock levels. Illustrate their computation by using the following information for a component 'ZYP'. Note: For more information about the factors that influence stock levels, read the discussion in the previous pages. Re-order level = Max. consumption per day / per week etc. x Max. re-order period = 75 units x 6 weeks = 450 Units Maximum Level = Re-order Level + Re-order Quantity - (Minimum consumption per day/per week etc. x Minimum time required to obtain supplies) = 450 units + 300 units - (25 units x 4 weeks) = 750 units - 100 units = 650 units Minimum Level = Re-Order level - (Normal consumption per day/per week etc. x Average re-order period) = 450 units - (50 units x 5 weeks) = 450 units - 250 units = 200 units (2) Two components, A and B, are used as follows: For each component, calculate the following: (1) Reorder Level = Maximum consumption per day/per week etc. x Maximum Re-Order Period Component A = 75 units X 6 weeks = 450 units Component B = 75 units X 4 weeks = 300 units (2) Minimum Level = Reorder Level - (Normal consumption per day/per week etc. x Average Re-order period) Component A = 450 units - (50 units x 5 weeks) = 200 units Component B = 300 units - (50 units x 3 weeks) = 150 units (3) Maximum Level = Reorder level - Reorder Quantity - (Minimum consumption per day/per week, etc. x Minimum Time Required to get supplies) Component A = 450 units + 400 units - (25 units x 4 weeks) = 850 units - 100 units = 750 units Component B = 300 units + 600 units - (25 units x 2 weeks) = 900 units - 50 units = 850 units (4) Average Stock Level = Minimum Level + 1/2 (Reorder Quantity) Component A = 200 units + (1 / 2 x 400 units) = 400 units Component B = 150 units + (1/2 x 600 units) = 450 units The figures shown below were taken from the records of John and Co. for the year ended 31 March 2019. The valuation of inventory is $1 per kg. Calculate the following: (1) Material consumed (2) Average inventory Average inventory = (Opening Stock + Closing Stock) / 2 Material X = (1,700 + 1,200) / 2 = 1,450 kgs. Material Y = (1,200 + 1,000) / 2 = 1,100 kgs. (3) Material turnover ratio = Material consumed during the period / Average Inventory Material X = 51,500 / 1,450 = 35.5 times (approx.) Material Y = 32,200 / 1,100 = 29.3 times (approx.) (4) Number of days average Inventory is held = Total No. of days in the period / Material Turnover Material X = 365 / 35.5 = 10.3 days (approx.) Material Y = 365 / 29.3 = 12.5 days (approx.) Consider the following information: Calculate the Economic Order Quantity (EOQ). The annual demand for a product is 6,400 units. The unit cost is $6 and the inventory carrying cost is 25% per annum. If the cost to procure one unit is $75, determine the following: 1. Calculation of EOQ 2. No. of orders per year = Annual consumption / Size of one order = 6,400 units / 800 units = 8 orders 3. Time gap between two consecutive orders = 12 months / No. of orders = 12 months / 8 orders = 1.5 monthsProblem 1: Calculation of Raw Materials to Produce Finished Products/Goods
Inputs (in pieces)
(including opening W.I.P)
Rejections
(in pieces)
Output
(in pieces)
A
18,000
6,000
12,000
B
19,800
1,800
18,000
C
20,400
3,400
17,000
Required
Solution
No. of Pieces
Rejected Pieces
Input
Output
No.
% of output
A
18,000
12,000
6,000
50%
B
19,800
18,000
1,800
10%
C
20,400
17,000
3,400
20%
Process
Input
Rejection
% Rejection of Output
Output
A
1,980
660
50%
1,320
B
1,320
120
10%
1,200
C
1,200
200
20%
1,000
Problem 2: Calculation of Maximum, Minimum, and Reorder Stock Levels
Normal Usage
50 per week
Minimum Usage
25 per week
Maximum Usage
75 per week
Re-order Quantity
300 units
Re-order Period
4 to 6 weeks
Solution
Required
Solution
Problem 3: Calculation of Material Turnover Ratio
Material 'X'
Material 'Y'
$
$
Opening Stock
1,700
1,200
Purchases
51,000
32,000
Closing Stock
1,200
1,000
Required
Solution
Material X
(kgs)
Material Y
(kgs)
Opening stock
Add: Purchases
1,700
51,000
1,200
32,000
52,700
33,200
Less: Closing Stock
1,200
1,000
51,500
32,200
Problem 4: Calculation of Economic Order Quantity
Task A
Required
Solution

Task B
Required
Solution

Material Costing: Practical Problems and Solutions FAQs
Material costing is a system that measures and records the cost of material consumed during a specified period. It involves recording and monitoring raw materials used to produce finished goods and services.
Material cost = material cost / quantity * 100
The most common problem faced by material cost accountants is that they collect too much data and do not analyze it effectively.
Determine the actual costs associated with producing products/services, so as to help managers make better decisions about pricing and allocating resources for future operations.
The two important methods of material costing are the first-in first-out method (fifo) last-in first-out method (lifo).
True Tamplin is a published author, public speaker, CEO of UpDigital, and founder of Finance Strategists.
True is a Certified Educator in Personal Finance (CEPF®), author of The Handy Financial Ratios Guide, a member of the Society for Advancing Business Editing and Writing, contributes to his financial education site, Finance Strategists, and has spoken to various financial communities such as the CFA Institute, as well as university students like his Alma mater, Biola University, where he received a bachelor of science in business and data analytics.
To learn more about True, visit his personal website or view his author profiles on Amazon, Nasdaq and Forbes.


