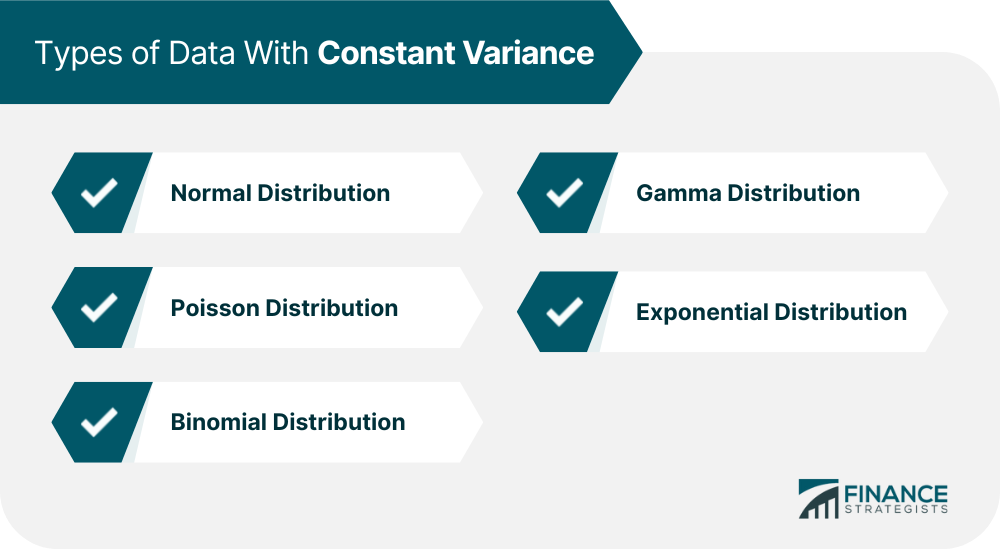
Constant variance, also known as homoscedasticity, is the statistical principle that states that all the data points in a dataset have an equal amount of variance. In other words, the variability in a data set should be consistent across all data points, with no extreme outliers. This assumption helps to ensure that statistical models can accurately predict future outcomes and draw conclusions from a given dataset. In simplest terms, constant variance is when all data points within a dataset are distributed equally about their mean value. This means that each point has approximately the same distance from the average or mean of the dataset. A good example of this can be seen when plotted on a graph; all points are equally spaced around their respective means in a bell-shaped curve. When evaluated statistically, these datasets show constancy in both their mean and standard deviation values. Data with constant variance may be classified into different probability distribution types, including: The normal distribution is a bell-shaped probability distribution that displays constant variance, meaning all data points have an equal amount of variance. It is known to be symmetrical, with most values falling in the center around its mean value and fewer lying at either end of the spectrum. The Poisson distribution is a discrete probability distribution that assumes a fixed number of successes over a given interval, often used to describe rare events such as fraudulent behavior or customer complaints. It also follows constant variance, meaning all data points in the dataset will have an equal amount of variability. The binomial distribution is a type of probability distribution that allows for two possible outcomes (“success” or “failure”). This type of distribution typically has a constant variance, meaning each point has approximately the same distance from its mean value in a bell-shaped curve. The gamma distribution is used to describe some continuous distributions, such as waiting time between events or population growth. It follows constant variance, meaning all data points will have an equal amount of variability dispersed evenly across the graph. The exponential distribution describes the average times taken for random occurrences to occur; it works well with processes that involve waiting times or rates of decay/growth. Like other types listed above, it also follows constant variance by having equal variability for each data point within its dataset. Because constant variance helps make models more accurate and reliable for predicting outcomes or drawing conclusions about relationships between variables, it is often used when modeling financial markets or conducting experiments with scientific studies where accuracy is key. Additionally, many machine-learning algorithms require that datasets exhibit some level of homoscedasticity before being used as input for training purposes. Using datasets with constant variance provides many advantages over less reliable methods, such as those which contain outlying observations or leverage points. These can add noise to results and generally hinder model accuracy by skewing test results and creating unreliable predictions when dealing with data sets that don’t follow linear patterns. On the other hand, obtaining reliable datasets with actual constancy in their spread may take a lot of work due to limitations associated with collecting real-world data and ensuring quality control processes are followed during the collection stages. A dataset with constant variance is useful for accurate predictions due to its ability to disregard outliers and leverage points. Apart from normal distributions, there are a handful of different probability distribution types, like Poisson, Binomial, Gamma, and Exponential distributions. However, it can be challenging to obtain reliable datasets with constancy in their spread due to data collection limitations and quality control processes. By understanding the different types of data sets that exhibit this property, businesses, and organizations can use the predictive power offered by datasets with constant variance.What Is Constant Variance?
Types of Data With Constant Variance

Normal Distribution
Poisson Distribution
Binomial Distribution
Gamma Distribution
Exponential DistributionApplications of Constant Variance
Advantages and Disadvantages of Using Constant Variance
Conclusion
Constant Variance FAQs
Constant variance is when all data points in a dataset have an equal amount of variability. This means that each point has approximately the same distance from its mean value in a bell-shaped curve, and therefore can be used to make more accurate predictions.
Normal, Poisson, Binomial, Gamma, and Exponential distributions all follow constant variance.
It’s essential to understand the different types of data sets that exhibit this property and potential bias or inaccuracies related to data collection techniques and sample sizes.
Data collection limitations and quality control processes can make it difficult to obtain reliable datasets with constancy in their spread.
By understanding the different types of data sets that exhibit this property, businesses and organizations can use the predictive power offered by datasets with constant variance.
True Tamplin is a published author, public speaker, CEO of UpDigital, and founder of Finance Strategists.
True is a Certified Educator in Personal Finance (CEPF®), author of The Handy Financial Ratios Guide, a member of the Society for Advancing Business Editing and Writing, contributes to his financial education site, Finance Strategists, and has spoken to various financial communities such as the CFA Institute, as well as university students like his Alma mater, Biola University, where he received a bachelor of science in business and data analytics.
To learn more about True, visit his personal website or view his author profiles on Amazon, Nasdaq and Forbes.


