The Liquidity Coverage Ratio (LCR) is a metric that compares the value of a bank’s most liquid assets with the volume of its short-term liabilities. The more significant the difference between the two, the more secure the bank’s financial situation. The LCR is part of the Basel III Accord. These are international guidelines created to strengthen banks against a possible financial crisis. Compliance with the liquidity coverage ratio has become part of standard safety measures for banks worldwide. Banks use the LCR to ensure that an adequate proportion of high-quality liquid assets are available to fulfill total net cash outflows over the next 30 calendar days. This makes it more of a short-term solution to possible liquidity problems. The Liquidity Coverage Ratio is an integral part of the regulations banks must observe. Each bank must maintain a sufficient level of highly liquid assets to meet potential cash outflows and protect itself from liquidity risk. The current minimum required by regulators for the Liquidity Coverage Ratio is 100%, meaning institutions must have enough unencumbered assets to cover any potential net cash outflows over the next 30 days. Bankers understand that meeting this requirement can be challenging and that it comes with its disadvantages. However, they know they must properly manage the bank’s assets to comply with this regulatory requirement. To calculate the LCR, banks must first know the value of their High-Quality Liquid Assets (HQLA) and their projected net cash outflows for the next 30 days. The formula for LCR is: High-Quality Liquid Assets are a key component of the financial markets. These assets provide liquidity for institutions and act as a cushion from market volatility. They can be divided into three categories: Net Cash outflows are the short-term liabilities a bank must fulfill during the upcoming 30-calendar-day period. For instance, it can include the estimated cash withdrawals and payments a bank expects to make. Regardless of the LCR value, the bank must ensure it meets this requirement. Below are some examples of how to calculate a bank’s LCR and interpret it. If Bank A has $100 million in HQLA and expects to have $150 million in net cash outflows over the next 30 days, its LCR would be calculated as follows: Bank A’s LCR = 100 million / 150 million = 66.7% With a 66.7% LCR, Bank A does not meet the regulatory minimum of 100% or greater. Thus, it needs to either increase the value of its total HQLA or decrease its cash outflows to comply with the requirement. In contrast with Bank A, Bank B has $200 million in HQLA and expects to have $150 million in net cash outflows over the next 30 days. Thus, its LCR would be calculated as follows: Bank B’s LCR = 200 million / 150 million = 133.3% Bank B meets and even surpasses the regulatory minimum of 100%. As such, it is compliant with this safety requirement. When comparing Bank A and Bank B based on their current liquidity coverage ratio, the latter is perceived to be more financially stable and more likely to withstand a short-term financial crisis. Despite its importance to a bank’s financial stability, the LCR has some limitations. The LCR requires banks to hold more liquid assets than they would have before the regulation. This can reduce the amount of capital available, thus potentially leading to a slowdown in economic activity. The requirement for banks to have sufficient liquidity also limits their ability to issue loans, as they must now prioritize maintaining a high-quality liquid asset position over extending new credit. Finally, the LCR provides only a short-term financial cushion as it is calculated using expected cash outflows over the next 30 days. Thus, if an unexpected event were to occur outside of this window, the bank may not be able to meet its obligations. The liquidity coverage ratio and the Net Stable Funding Ratio (NSFR) are necessary regulations that aim to ensure banks have adequate liquidity and funding, especially in times of financial crisis. Both were introduced under the Bassel III Accord. The primary difference between the two is the time horizon they cover. The LCR focuses on short-term liquidity needs, whereas the NSFR looks at whether a bank has enough stable funding sources to meet its obligations over a more extended period. In terms of calculation, the LCR looks at the ability of a bank to meet cash outflows over the next 30-day period using its high-quality liquid assets. In contrast, the NSFR uses both liquid and non-liquid assets to determine the bank's funding over the next 12 months. Both regulations are essential to ensure the banking system's stability. Thus, banks should consider both ratios when making decisions. With proper planning and management, these can be used to strengthen a bank's position and boost financial confidence. The Liquidity Coverage Ratio or LCR is a financial regulation introduced by the Basel III banking reform. It requires banks to hold enough assets to meet 100% of their short-term obligations and maintain stability during financial stress. It is calculated by comparing the total amount of the bank's high-quality liquid assets with its projected net cash outflows over the next 30 days. In other words, it considers both potential liabilities and liquid assets within that timeframe. Despite its merits, LCRs only serve as a short-term cushion that requires banks to hold on to more cash and reduce the issuance of loans. Thus, it is vital to consider it with more long-term metrics like the Net Stable Funding Ratio or NSFR. Banks must deal with liquidity risk management on an ongoing basis. They must also provide regular reports about their LCR and NSFR compliance for review by their respective regulatory agencies. If you are seeking reliable banks where you can safely store your assets, you can research your prospects' liquidity coverage ratio before selecting one.What Is the Liquidity Coverage Ratio (LCR)?
Required Minimum for Liquidity Coverage Ratio (LCR)
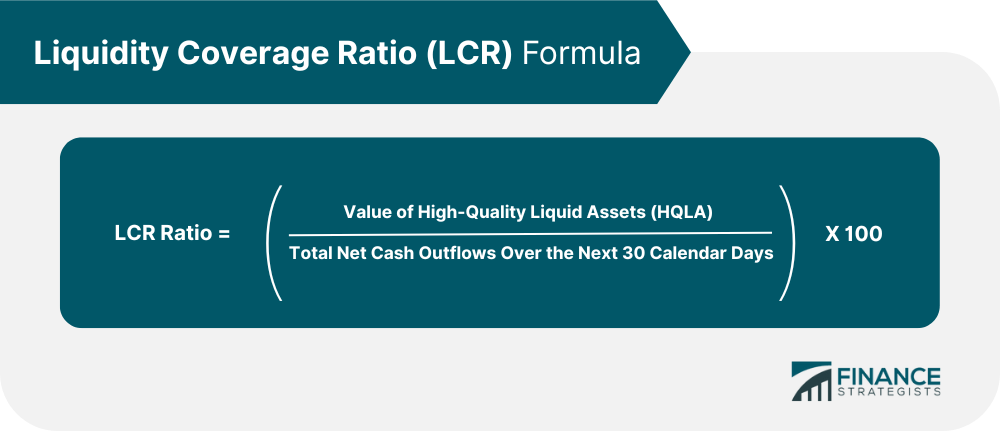
How to Calculate the Liquidity Coverage Ratio (LCR)
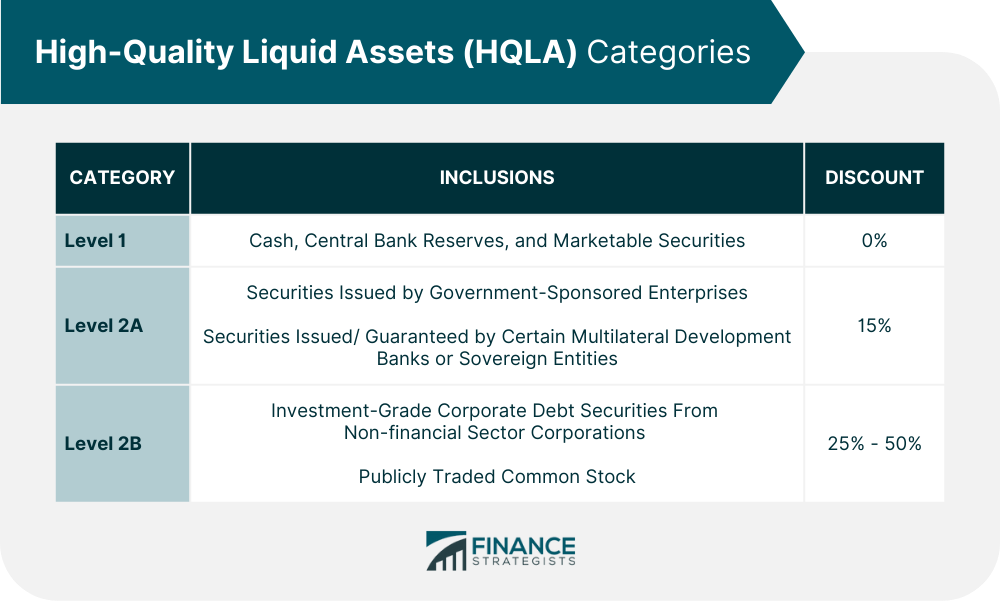
High-Quality Liquid Assets (HQLA)
They are subject to a 15% discount, so only 85% of their value is included in the calculation.
Net Cash Outflows
Since the total value of a bank’s high-quality liquid assets and its projected net cash outflows may change monthly, its liquidity coverage ratio is also expected to adjust accordingly. Examples of the LCR
Limitations of the LCR
Requires Banks to Hold More Cash
Reduces Issuance of Bank Loans
Offers Only Short-term Financial Cushion
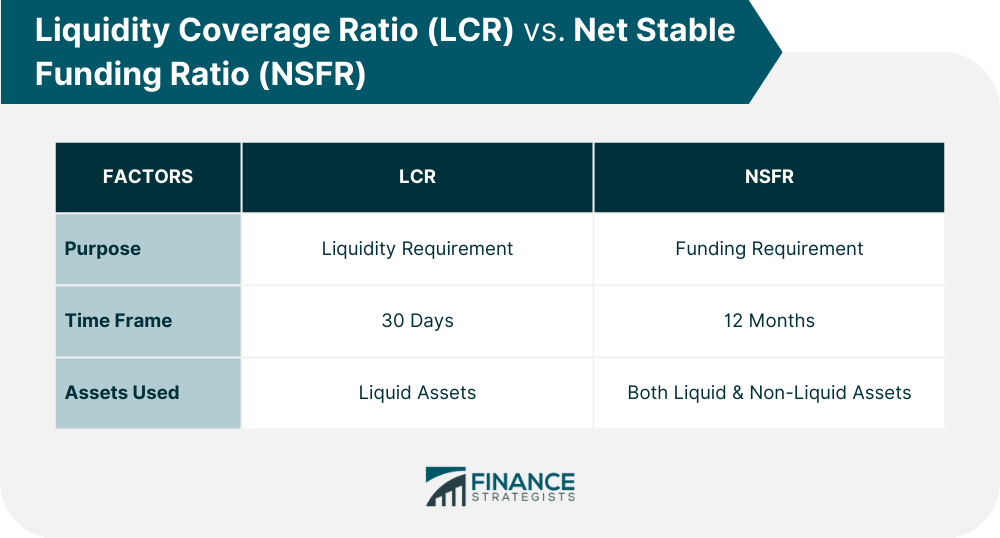
Liquidity Coverage Ratio (LCR) vs. Net Stable Funding Ratio (NSFR)
Final Thoughts
Liquidity Coverage Ratio FAQs
The LCR is calculated by dividing the value of high-quality liquid assets (HQLA) by total net cash outflows over the next 30 calendar days and multiplying the quotient by 100 to produce a percentage.
To manage their LCR, banks must monitor their liquidity levels regularly. They should also be aware of and comply with any changes in regulations. Finally, when making decisions, they should consider essential indicators, such as the LCR and the Net Stable Funding Ratio.
A higher LCR indicates that the bank has enough high-quality liquid assets to cover its expected cash outflows over the next 30 calendar days. This implies that the bank is likely well-prepared for any potential financial stress events and should have enough liquidity to meet its obligations.
High-quality liquid assets that can be used to meet the LCR include cash, central bank reserves, certain types of securities, and publicly traded common stock. However, some of these assets are discounted, so their total value is not considered in the LCR calculation.
Systemically important financial institutions (SIFIs) must have an LCR of at least 100%, meaning that the value of their high-quality liquid assets must be greater than or equal to their total expected cash outflows over the next 30 calendar days.
True Tamplin is a published author, public speaker, CEO of UpDigital, and founder of Finance Strategists.
True is a Certified Educator in Personal Finance (CEPF®), author of The Handy Financial Ratios Guide, a member of the Society for Advancing Business Editing and Writing, contributes to his financial education site, Finance Strategists, and has spoken to various financial communities such as the CFA Institute, as well as university students like his Alma mater, Biola University, where he received a bachelor of science in business and data analytics.
To learn more about True, visit his personal website or view his author profiles on Amazon, Nasdaq and Forbes.