Z-spread is a credit spread measure that represents the amount of additional yield an investor expects to receive over the entirety of the spot rate Treasury yield curve to justify taking on the credit risk inherent in an otherwise non-Treasury security. Essentially, it quantifies the extra margin of return an investor demands for bearing the default risk in a bond investment compared to risk-free Treasury securities. Z-spread plays a vital role in the financial markets, particularly within the realm of fixed-income investing. It serves as a critical tool for pricing and valuing bonds, especially corporate bonds where credit risk can significantly affect bond valuation. By calculating the Z-spread, investors and analysts can evaluate the bond's risk premium, thus assisting in determining whether the bond is overpriced or underpriced relative to its inherent risk. Clean price is the price of a bond excluding any accrued interest. It represents the actual market value of the bond, separate from the interest that accumulates over time. In calculating the Z-spread, it serves as the starting point and aids in determining the present value of future cash flows. Accrued interest represents the interest that has accumulated on a bond since the last interest payment date. It is part of the bond's total return to an investor. The accrued interest is accounted for to give a more precise measure of a bond's total return, thus providing a more accurate Z-spread value. The present value of cash flows is the current worth of the future cash flows expected from the bond, discounted at the spot rate. The concept of present value is crucial in the computation of Z-spread because it reflects the idea that money available today is worth more than the same amount in the future due to its potential earning capacity. Yield to maturity (YTM) is the total expected return on a bond if it is held until its maturity date. YTM plays a vital role in calculating Z-spread, as it provides the reference rate at which the present value of a bond's cash flows equals its price. The spot rate curve, or zero-coupon yield curve, is a graphical representation of the yields on zero-coupon bonds for various maturities. The spot rate curve is critical for determining Z-spread because it offers the benchmark rates used in discounting the bond's future cash flows. The first step involves identifying all the future cash flows expected from the bond. This includes the periodic interest payments and the repayment of the principal at maturity. The identified cash flows are then discounted back to the present using the corresponding risk-free spot rate plus the Z-Spread. The spot rates correspond to the maturity of each cash flow, ensuring a more accurate valuation that reflects the term structure of interest rates. The Z-Spread is essentially the constant spread that needs to be added to each spot rate such that the sum of the discounted cash flows equals the bond's market price. This involves an iterative process because the Z-Spread itself is not known at the outset, and its value depends on the bond's price. Once calculated, the Z-Spread can be interpreted as a measure of the bond's credit risk relative to the risk-free rate. A higher Z-Spread indicates that investors demand more compensation for the added credit risk they are assuming. Additionally, spreadsheet software like Microsoft Excel can be used for Z-spread calculations, especially when custom models or scenarios need to be built. Interest rates play a crucial role in determining the Z-spread. When interest rates rise, the Z-spread decreases because the yield of risk-free bonds increases, making risky bonds less attractive. Conversely, when interest rates fall, the Z-spread increases because the yield of risk-free bonds decreases, making risky bonds more appealing. The creditworthiness of the bond issuer significantly impacts the Z-spread. If a company has a higher risk of default (as reflected in its credit ratings), the Z-spread will be larger to compensate investors for the additional risk. On the other hand, if a company is more creditworthy, the Z-spread will be smaller, reflecting the reduced risk. Market liquidity can also influence the Z-spread. In a liquid market, where bonds can be easily bought or sold, the Z-spread may be narrower due to lower transaction costs and less risk. In contrast, in a less liquid market, the Z-spread may be wider to compensate investors for the higher transaction costs and greater risk associated with buying or selling the bond. The time to maturity of the bond impacts the Z-spread. Bonds with longer maturities typically have wider Z-spreads to compensate for the increased interest rate risk and credit risk associated with a longer time horizon. Bonds with shorter maturities have narrower Z-spreads, reflecting the lower risk. The Z-spread is a crucial component in determining a bond's fair price. If the calculated price of a bond, using the Z-spread, is higher than the current market price, it indicates that the bond may be undervalued, suggesting a potential buying opportunity. Conversely, if the calculated price is lower than the market price, the bond may be overvalued, signaling a potential selling opportunity. By assessing how changes in Z-spread impact the bond's price, investors can evaluate the potential risks and rewards of a bond under different scenarios. The sensitivity analysis helps in making informed investment decisions and managing risk more effectively. Interest rate risk refers to the risk of a change in bond prices due to fluctuations in interest rates. Z-spread is a valuable tool for managing this risk as it can help predict how a bond's price might change with shifts in the yield curve. Credit risk refers to the risk of loss resulting from a bond issuer's failure to repay principal or interest. A larger Z-spread implies higher credit risk, alerting investors to potentially risky bonds. Therefore, tracking changes in the Z-spread over time can provide early warning signals of changing credit conditions. Market risk refers to the risk of losses in a bond's value due to changes in financial markets. By analyzing the relationship between Z-spread and market conditions, investors can manage market risk more effectively and align their bond portfolios with market trends. In portfolio management, the Z-spread is a vital tool for comparing bonds and making investment decisions. Portfolio managers use it to assess the relative value of different bonds and construct a portfolio that provides the best possible return for a given level of risk. They can also use it to monitor the performance of their portfolio and make necessary adjustments to align with their investment objectives. In asset and liability management (ALM), the Z-spread can play a crucial role. ALM focuses on managing risks that arise due to mismatches between the assets and liabilities. By using Z-spread, firms can assess the spread risk of their assets and liabilities and manage them more effectively. For example, if the Z-spread of assets is higher than the liabilities, it suggests that the firm is adequately compensated for the risk it is taking. Z-spread is also used in various fixed income trading strategies. Traders might use Z-spread to identify mispriced bonds in the market and execute trades to capitalize on these pricing discrepancies. Additionally, they can use it in relative value trading strategies, where they compare the Z-spread of two or more similar bonds and take positions based on the expected convergence or divergence of these spreads. One of the major limitations of the Z-spread is that it assumes that cash flows from the bond are certain, which might not be the case with callable or putable bonds. In these cases, the cash flows might change due to the bond's embedded options, making the Z-spread an inappropriate measure. For bonds with embedded options, the option-adjusted spread is a better measure. Z-spread also assumes that the credit spread is constant over the bond's life. However, in reality, the credit spread can change due to shifts in the issuer's creditworthiness or changes in market conditions. This limitation can lead to inaccuracies in the Z-spread measurement, particularly for bonds with longer maturities. The calculation of Z-spread involves an iterative process, which can be complex and time-consuming. This complexity can be a barrier for individual investors or small firms that do not have access to sophisticated financial tools or software. Z-spread calculation relies heavily on the spot rate curve, which is usually derived from the yields of Treasury securities. However, these derived curves might not always be accurate or reflective of the current market conditions, leading to potential errors in the Z-spread. Lastly, the calculation of Z-spread requires extensive market data, including the prices of bonds, their cash flows, and spot rates. This data might not always be readily available, especially for less liquid bonds or bonds from emerging markets, limiting the applicability of Z-spread in these cases. Z-spread is a critical credit spread measure used in fixed-income investing to evaluate the additional yield investors expect to receive over the risk-free rate to compensate for the credit risk of a bond. The Z-spread calculation involves discounting future cash flows using the spot rate curve and iteratively determining the constant spread needed to make the sum of discounted cash flows equal the bond's market price. Factors such as interest rates, issuer creditworthiness, market liquidity, and time to maturity affect the Z-spread. While the Z-spread has limitations, such as ignoring option risk and assuming a constant spread, it is widely used in financial markets, with professional platforms and spreadsheet software offering tools for its calculation. By understanding the Z-spread's interpretation and its relationship with credit risk, investors can make informed investment decisions and manage risk effectively. It is useful in asset and liability management, fixed income trading strategies, and portfolio construction. It is best to consult with a qualified financial advisor or professional who has expertise in fixed-income markets and bond valuation. They can provide personalized guidance and help make well-informed investment decisions based on individual goals, risk tolerance, and market conditions.What Is the Zero Volatility Spread (Z-Spread)?
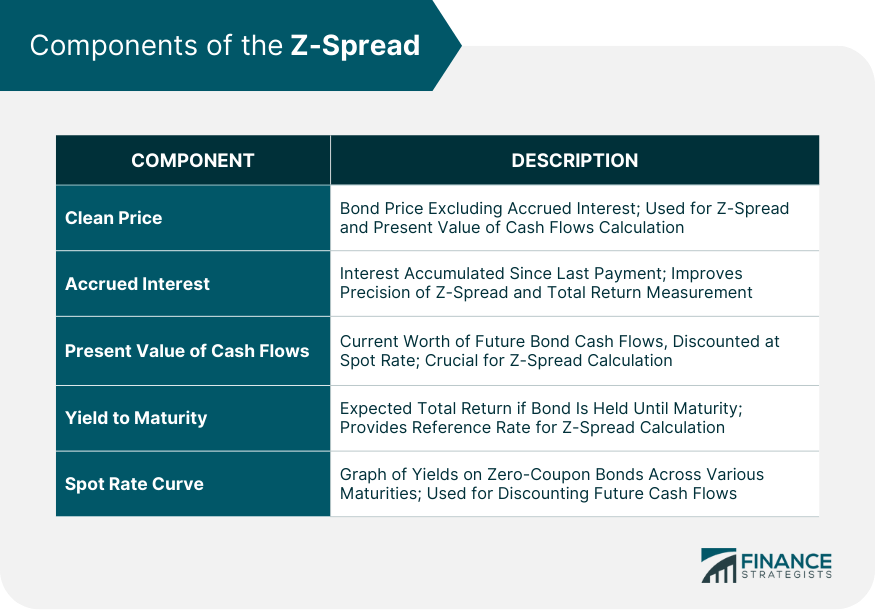
Components of the Z-Spread
Clean Price
Accrued Interest
Present Value of Cash Flows
Yield to Maturity
Spot Rate Curve

How the Z-Spread Works
Establishing Cash Flows
Discounting Cash Flows
Calculating the Z-Spread
Interpreting the Z-Spread
Tools and Software for Calculating
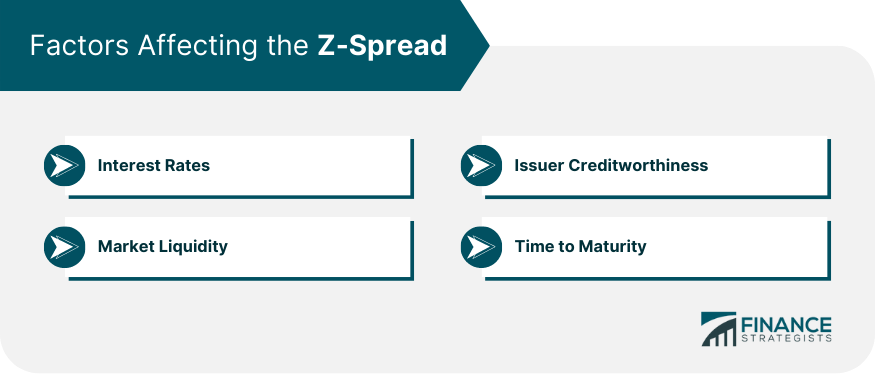
Many professional financial platforms like Bloomberg and Reuters provide tools for calculating Z-spread. These platforms not only calculate Z-spread but also provide insights into market data, which is often used in Z-spread calculations. Factors Affecting the Z-Spread
Interest Rates
Issuer Creditworthiness
Market Liquidity
Time to Maturity

Z-Spread in Bond Pricing
Determining the Fair Price
Sensitivity Analysis
Z-Spread in Risk Management
Interest Rate Risk
Credit Risk
Market Risk
Z-Spread in Investment Strategies
Portfolio Management
Asset and Liability Management
Fixed Income Trading Strategies
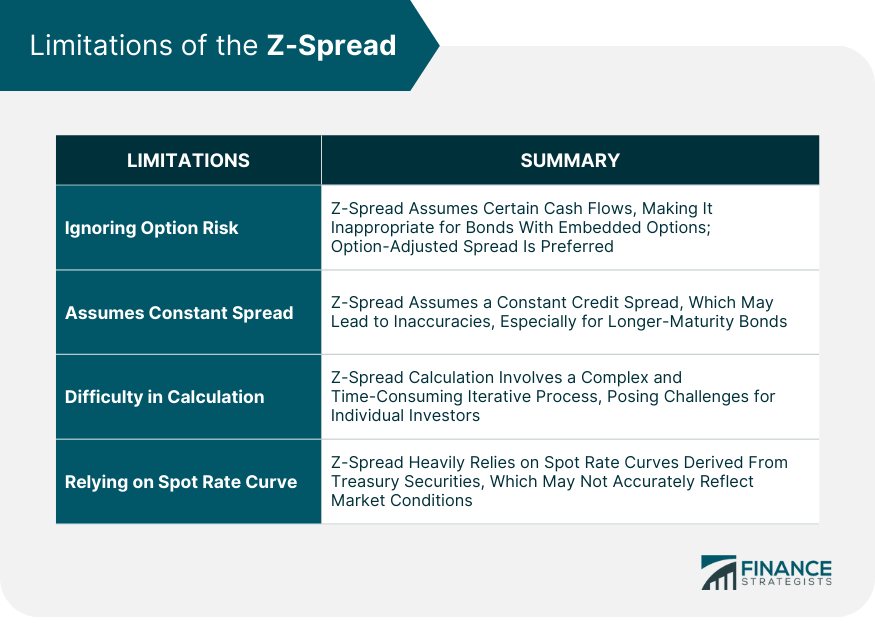
Limitations of the Z-Spread
Ignoring Option Risk
Assumes Constant Spread
Difficulty in Calculation
Relying on Spot Rate Curve
Requires Market Data

Final Thoughts
Zero Volatility Spread (Z-Spread) FAQs
The Z-spread is calculated to quantify the additional yield or spread that investors demand to compensate for the credit risk of a bond compared to risk-free Treasury securities. It helps in pricing and valuing bonds, especially corporate bonds, by evaluating the bond's risk premium and determining whether it is overpriced or underpriced relative to its inherent risk.
The YTM represents the total expected return on a bond if held until maturity, while the Z-spread measures the credit risk premium added to the risk-free spot rate to justify taking on the credit risk of a bond. Unlike YTM, the Z-spread considers different reinvestment rates for each cash flow and provides a more comprehensive view of a bond's yield by incorporating the shape of the yield curve.
Several factors influence the Z-spread, including interest rates, issuer creditworthiness, market liquidity, and the time to maturity of the bond. Changes in these factors can impact the Z-spread, as higher interest rates, lower creditworthiness, lower market liquidity, and longer maturities tend to result in wider spreads to compensate for increased risk.
The Z-spread is a valuable tool in various investment strategies. It assists portfolio managers in comparing bonds, making investment decisions, and constructing portfolios that provide optimal returns for a given level of risk. Additionally, traders can use the Z-spread to identify mispriced bonds and execute trades to capitalize on pricing discrepancies, while asset and liability managers can assess the spread risk of their assets and liabilities for effective risk management.
The Z-spread is commonly used for non-Treasury securities, especially corporate bonds, where credit risk significantly affects bond valuation. However, its applicability may vary for bonds with embedded options, such as callable or putable bonds. For bonds with embedded options, the option-adjusted spread (OAS) is a more appropriate measure as it considers the value of these options and potential changes in cash flows. Therefore, while the Z-spread is widely used, its suitability should be assessed based on the specific characteristics of the bond being analyzed.
True Tamplin is a published author, public speaker, CEO of UpDigital, and founder of Finance Strategists.
True is a Certified Educator in Personal Finance (CEPF®), author of The Handy Financial Ratios Guide, a member of the Society for Advancing Business Editing and Writing, contributes to his financial education site, Finance Strategists, and has spoken to various financial communities such as the CFA Institute, as well as university students like his Alma mater, Biola University, where he received a bachelor of science in business and data analytics.
To learn more about True, visit his personal website or view his author profiles on Amazon, Nasdaq and Forbes.


