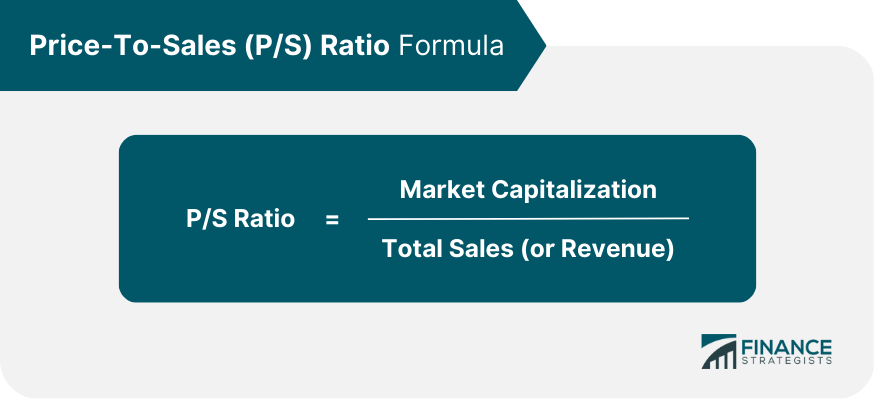
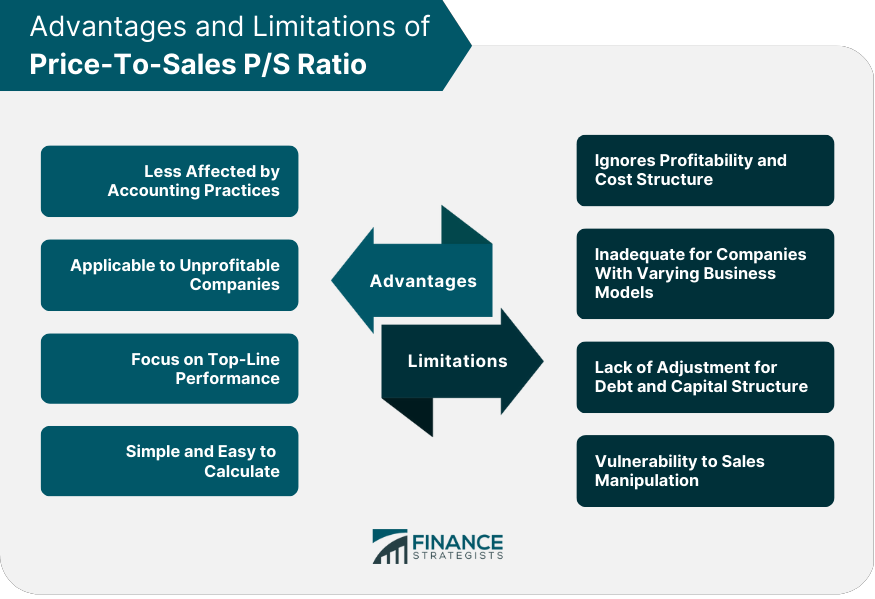
The P/S ratio is a financial valuation metric that compares a company's stock price or market capitalization to its sales or revenue. It is used by investors, analysts, and portfolio managers to assess the relative value of a company's shares and identify potential investment opportunities. The P/S ratio is an essential tool for financial analysis because it provides a straightforward method for evaluating a company's financial performance and market valuation. It is especially helpful when other valuation metrics, such as the price-to-earnings (P/E) ratio, are not applicable due to negative or non-existent earnings. While the P/S ratio is a valuable tool, it is essential to consider it in conjunction with other valuation metrics, such as the P/E ratio, price-to-book (P/B) ratio, and enterprise value-to-EBITDA (EV/EBITDA) ratio. Each metric provides a different perspective on a company's financial health, and using them together can help investors make more informed decisions. The P/S ratio is calculated using the following formula: Market Capitalization or Stock Price represents the total market value of a company's outstanding shares, while Total Sales or Revenues reflects the total income generated by a company's business activities during a specific period, typically one year. As a general rule, a lower P/S ratio may indicate that a company is potentially undervalued, while a higher P/S ratio might suggest that a company is potentially overvalued. However, these guidelines are not absolute, and other factors must be considered. To accurately assess a company's P/S ratio, it is essential to compare it to industry benchmarks or peers. Different industries have varying P/S ratios due to differences in growth rates, profit margins, and risk factors. For example, technology companies typically have higher P/S ratios than companies in the utility sector, reflecting the differences in growth prospects and risk profiles. The P/S ratio is less susceptible to manipulation through accounting practices compared to other valuation metrics, such as the P/E ratio. Sales figures are generally more stable and less prone to distortions resulting from accounting decisions. The P/S ratio can be used to value companies that have not yet achieved profitability or are experiencing temporary losses. This feature makes it a valuable tool for evaluating early-stage or cyclical companies where the P/E ratio may not be applicable. The P/S ratio focuses on a company's top-line performance (sales or revenue) rather than bottom-line performance (earnings). This can be helpful in identifying companies with strong sales growth that may not yet be reflected in their earnings. The P/S ratio is straightforward and easy to calculate, making it accessible to a wide range of investors and analysts. The P/S ratio does not consider a company's profitability or cost structure. A high P/S ratio might not necessarily indicate an overvalued company if it has strong profit margins and growth potential. The P/S ratio might not be suitable for companies with diverse business models, as it does not account for differences in profit margins, growth rates, and risk factors among various segments. The P/S ratio does not consider a company's debt and capital structure, which can impact its valuation. Investors should analyze additional metrics, such as the debt-to-equity ratio or EV/EBITDA, to gain a complete understanding of a company's financial health. Although the P/S ratio is generally less susceptible to manipulation than other valuation metrics, it is not entirely immune. Companies may engage in aggressive sales practices, such as channel stuffing or premature revenue recognition, to inflate their sales figures and P/S ratios. The P/S ratio can be used as a stock screening tool to identify potentially undervalued or overvalued companies based on their historical and industry P/S ratios. The P/S ratio can be applied in merger and acquisition analysis to determine the relative value of target companies and assess the attractiveness of potential deals. Investors can use the P/S ratio to evaluate their portfolio's diversification, ensuring that they hold a mix of companies with varying P/S ratios and growth profiles. The P/S ratio can help identify potential turnaround candidates, as companies with low P/S ratios may be undervalued and poised for future growth. The price-to-sales ratio is a valuable financial valuation metric that compares a company's stock price or market capitalization to its sales or revenue. It offers several advantages, such as being less affected by accounting practices and applicable to unprofitable companies. However, it also has limitations, including ignoring profitability and cost structure and not accounting for debt and capital structure. To effectively use the P/S ratio, investors must consider it in the context of other valuation metrics, such as P/E, P/B, and EV/EBITDA, and assess a company's financial health comprehensively. Industry comparisons, historical trends, and other factors should also be taken into account to make informed investment decisions. Despite its limitations, the P/S ratio remains a relevant and widely-used tool in financial analysis. By understanding its strengths and weaknesses, investors can use the P/S ratio as part of a broader toolkit to assess the value of a company's shares and identify potential investment opportunities. Consult a wealth management practitioner or financial advisor for further information and guidance on using the P/S ratio to reach your financial goals.What Is Price-To-Sales (P/S) Ratio?
Calculation of P/S Ratio

Interpretation and Analysis of P/S Ratio
Advantages of P/S Ratio
Less Affected by Accounting Practices
Applicable to Unprofitable Companies
Focus on Top-Line Performance
Simple and Easy to Calculate
Limitations of P/S Ratio
Ignores Profitability and Cost Structure
Inadequate for Companies with Varying Business Models
Lack of Adjustment for Debt and Capital Structure
Vulnerability to Sales Manipulation

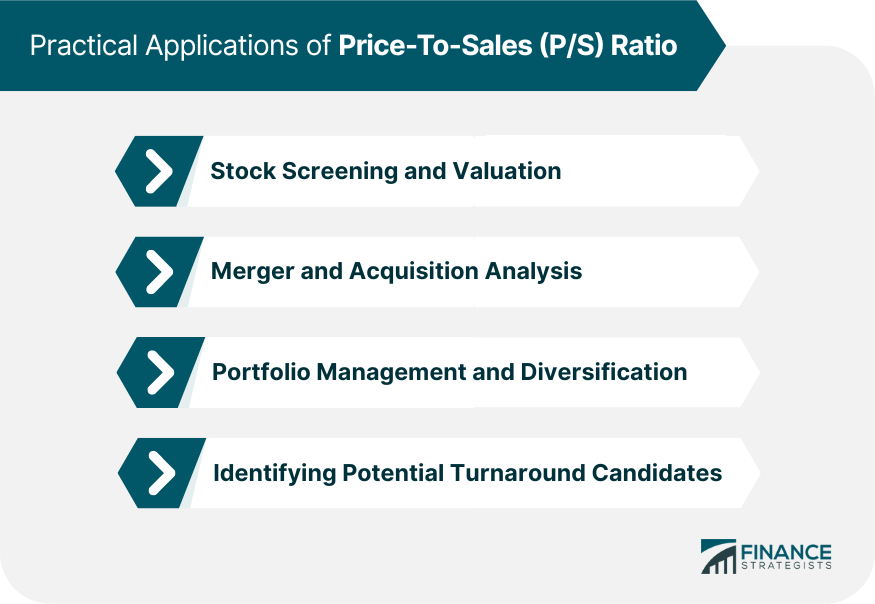
Practical Applications of P/S Ratio
Stock Screening and Valuation
Merger and Acquisition Analysis
Portfolio Management and Diversification
Identifying Potential Turnaround Candidates

Final Thoughts
Price-To-Sales (P/S) Ratio FAQs
The P/S ratio compares a company's market capitalization (or stock price) to its total sales or revenue, providing a measure of the company's valuation relative to its sales. A lower P/S ratio may indicate that a company is undervalued, while a higher P/S ratio could suggest overvaluation. However, the P/S ratio should be considered in conjunction with other valuation metrics, industry comparisons, and historical trends for a comprehensive understanding of a company's financial health.
Yes, the P/S ratio is particularly useful for evaluating companies with negative earnings or temporary losses, as it focuses on the top-line performance (sales or revenue) rather than bottom-line performance (earnings). This feature makes the P/S ratio a valuable tool for analyzing early-stage or cyclical companies where other valuation metrics, such as the P/E ratio, may not be applicable.
While the P/S ratio is an important valuation metric, it should be used in conjunction with other metrics like P/E, P/B, and EV/EBITDA to gain a comprehensive understanding of a company's financial health. Each metric provides a different perspective on a company's valuation and performance. For example, the P/E ratio focuses on earnings, the P/B ratio on book value, and EV/EBITDA on earnings before interest, taxes, depreciation, and amortization.
Some limitations of the P/S ratio include its inability to account for a company's profitability, cost structure, debt, and capital structure. It may also be inadequate for companies with varying business models or segments. Investors should consider these limitations and use the P/S ratio alongside other valuation metrics and qualitative factors to make well-informed investment decisions.
The P/S ratio can be used in various ways, such as stock screening to identify potentially undervalued or overvalued companies, merger and acquisition analysis, portfolio management and diversification, and identifying potential turnaround candidates. However, it is essential to use the P/S ratio in conjunction with other valuation metrics, industry comparisons, and historical trends to make informed investment decisions.
True Tamplin is a published author, public speaker, CEO of UpDigital, and founder of Finance Strategists.
True is a Certified Educator in Personal Finance (CEPF®), author of The Handy Financial Ratios Guide, a member of the Society for Advancing Business Editing and Writing, contributes to his financial education site, Finance Strategists, and has spoken to various financial communities such as the CFA Institute, as well as university students like his Alma mater, Biola University, where he received a bachelor of science in business and data analytics.
To learn more about True, visit his personal website or view his author profiles on Amazon, Nasdaq and Forbes.


