The payout ratio is a financial metric that measures the proportion of earnings a company pays its shareholders in the form of dividends, expressed as a percentage of the company's total earnings. It is a crucial indicator for investors and analysts, providing insights into a company's dividend policy, financial health, and growth potential. The payout ratio is vital in financial analysis as it helps determine a company's ability to maintain or grow its dividend payments. It also aids in comparing dividend policies across different companies and industries, making it easier for investors to make informed decisions. The payout ratio is calculated using the following formula: Assume a company has earnings per share (EPS) of $2 and pays an annual dividend of $1 per share. Using the given formula, the payout ratio would be: The dividend payout ratio is the most common type of payout ratio. It measures the percentage of earnings paid out as dividends to shareholders. The retention ratio, also known as the plowback ratio or earnings retention ratio, is the opposite of the payout ratio. It measures the percentage of earnings retained by the company for reinvestment or to pay off debt. A high payout ratio indicates that a company is paying a large portion of its earnings as dividends. This could be a sign of a mature company with limited growth opportunities. However, a consistently high payout ratio might also suggest that the company is not retaining sufficient earnings to support future growth or pay off debt. A low payout ratio signifies that a company is retaining a higher percentage of its earnings. This is typically an indication of a growing company, as it has the resources to reinvest in the business or pay off debt. However, a low payout ratio might disappoint income-oriented investors seeking regular dividend payments. Several factors influence the payout ratio, including industry characteristics, company size, growth potential, and management's dividend policy. It Is essential to consider these factors when interpreting payout ratios for different companies. Companies can have different dividend policies, such as: Constant Dividend Payout Ratio Policy: The company maintains a consistent payout ratio over time. Stable Dividend Policy: The company pays a fixed dividend amount per share. Residual Dividend Policy: The company pays dividends from residual earnings after funding all planned investments. The payout ratio can impact a company's dividend policy as it signals management's intentions regarding dividend payments and earnings retention. A company with a high payout ratio may prioritize income for shareholders, while a low payout ratio indicates a focus on growth and reinvestment. The payout ratio varies across industries due to differences in growth potential, capital requirements, and financial stability. Mature industries with stable cash flows, such as utilities and consumer staples, typically have higher payout ratios. In contrast, growth-oriented industries like technology and biotechnology often have It is crucial to compare payout ratios within the same industry to obtain meaningful insights. Industry-specific benchmarks help investors and analysts assess a company's dividend policy and financial health relative to its peers. Value investors may use the payout ratio as a criterion for selecting undervalued stocks. A low payout ratio combined with a high dividend yield might indicate an undervalued stock with the potential for dividend growth. Income-oriented investors, such as retirees, often seek stocks with high payout ratios, as they provide regular dividend income. However, ensuring the company can sustain its dividend payments is crucial to avoid potential dividend cuts or financial distress. Growth investors typically prefer companies with low payout ratios as they indicate a focus on reinvestment and future growth. A low payout ratio combined with strong earnings growth can signal a company with significant growth potential. The payout ratio can impact stock valuation by providing insights into a company's financial health, dividend policy, and growth prospects. A high payout ratio may indicate limited growth opportunities, while a low payout ratio suggests potential for future expansion. The Dividend Discount Model (DDM) is a valuation method that estimates the intrinsic value of a stock based on its future dividend payments. The payout ratio is a crucial input in this model, as it determines the proportion of earnings distributed as dividends. A higher payout ratio results in higher estimated dividends, potentially increasing the stock's valuation. The payout ratio tends to fluctuate during different market cycles. Companies may experience higher earnings in a bull market and opt for a lower payout ratio to invest in growth opportunities. In contrast, during bear markets or economic downturns, companies may maintain or increase their payout ratios to signal financial stability and attract income-seeking investors. Investor sentiment can also influence the payout ratio. During periods of optimism, investors may favor growth stocks with lower payout ratios. During periods of pessimism or uncertainty, they may shift their focus to defensive stocks with higher payout ratios and stable dividend payments. The payout ratio reflects management's decisions regarding dividend payments and earnings retention. When determining the payout ratio, a transparent and accountable management team will consider the company's long-term growth prospects, financial health, and shareholder expectations. In some cases, the payout ratio can become a point of contention between management and shareholders, leading to shareholder activism. Shareholders may push for a higher payout ratio if they believe the company is not effectively utilizing retained earnings or if they seek higher dividend income. Conversely, shareholders may advocate for a lower payout ratio if they believe reinvestment can drive future growth and create long-term value. Some limitations of the payout ratio include: Not accounting for differences in growth rates and risk levels among companies. Susceptibility to earnings manipulation through accounting practices. Inability to provide a complete picture of a company's financial health and growth potential. Given the limitations of the payout ratio, investors can also consider alternative metrics such as: Dividend Yield: Indicates the annual dividend income per share relative to the stock price. Free Cash Flow (FCF) Payout Ratio: Compares dividends paid to the company's free cash flow, which may provide a more accurate representation of the company's ability to pay dividends. Dividend Growth Rate: Measures the historical growth of dividends over time. The payout ratio serves as a vital financial metric for investors, enabling them to gain insights into a company's dividend policy, financial health, and growth potential. By considering the payout ratio in conjunction with other financial metrics and qualitative factors, investors can make well-informed decisions and build a diversified investment portfolio. The payout ratio measures the proportion of earnings paid out as dividends to shareholders. A high payout ratio may signal a mature company with limited growth opportunities, while a low payout ratio may indicate a growing company with reinvestment potential. The payout ratio varies across industries and should be compared within the same industry for meaningful insights. Payout ratio trends can change during different market cycles, influenced by investor sentiment and corporate governance. To optimize your investment strategy and navigate the complexities of payout ratios and other financial metrics, consider seeking the expertise of professional wealth management services. A wealth management expert can provide personalized advice tailored to your unique financial goals and risk tolerance, ensuring that you make the most of your investment opportunities.What Is Payout Ratio?
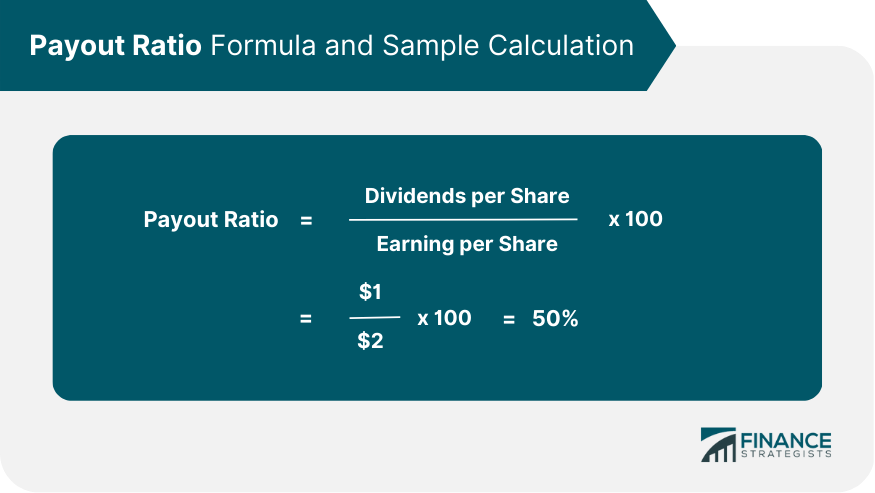
Formula and Calculation of Payout Ratio

Types of Payout Ratios
Dividend Payout Ratio
Retention Ratio (1 - Payout Ratio)
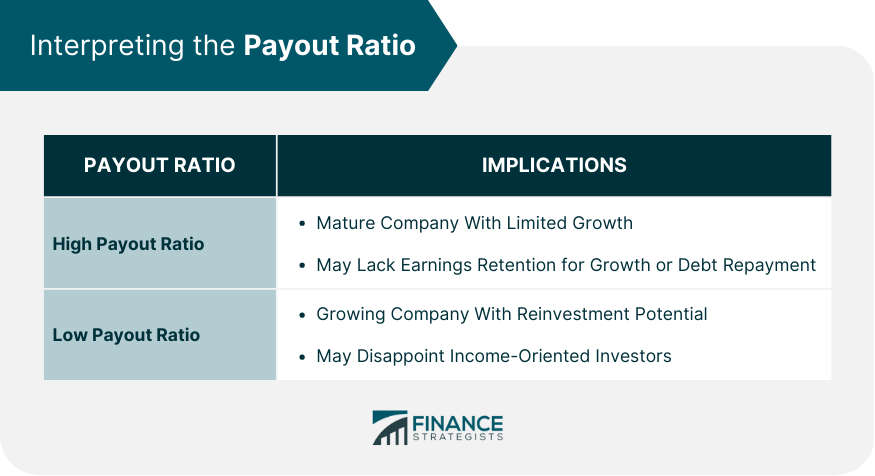
Interpreting the Payout Ratio
High Payout Ratio Implications
Low Payout Ratio Implications

Factors Influencing the Payout Ratio
Payout Ratio and Dividend Policy
Dividend Policy Types
Payout Ratio's Influence on Dividend Policy
Payout Ratio in Different Industries
Payout Ratio Variations Across Industries
Industry-Specific Payout Ratio Benchmarks
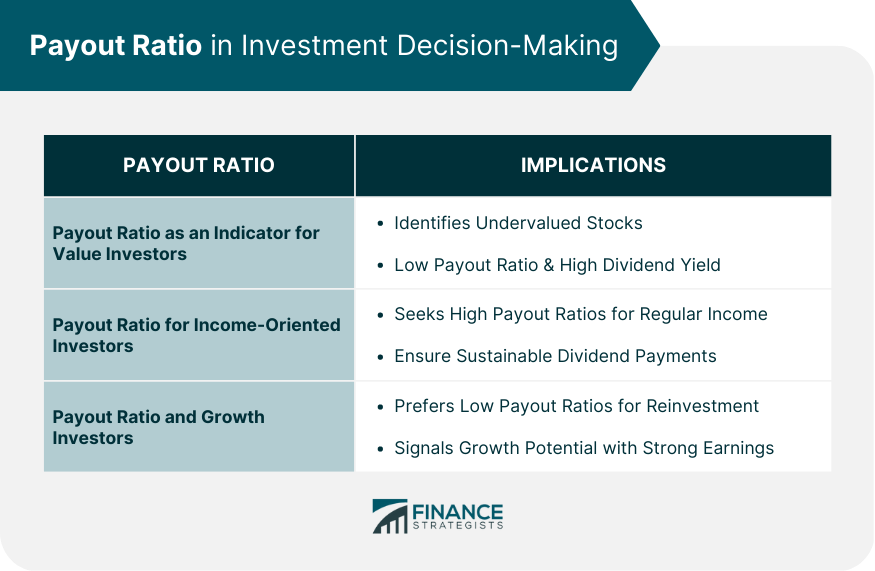
Payout Ratio in Investment Decision-Making
Payout Ratio as an Indicator for Value Investors
Payout Ratio for Income-Oriented Investors
Payout Ratio and Growth Investors

Payout Ratio and Stock Valuation
Payout Ratio's Impact on Stock Valuation
Dividend Discount Model and Payout Ratio
Payout Ratio and Market Cycles
Payout Ratio Trends During Market Cycles
Payout Ratio and Market Sentiment
Payout Ratio and Corporate Governance
Payout Ratio and Management Decisions
Payout Ratio and Shareholder Activism
Payout Ratio Limitations and Criticisms
Limitations of Payout Ratio
Alternative Metrics to Payout Ratio
Final Thoughts
Payout Ratio FAQs
The payout ratio is a financial metric that measures the percentage of earnings a company pays out to its shareholders as dividends. It is important for investors because it provides insights into a company's dividend policy, financial health, and growth potential, allowing them to make informed investment decisions.
The payout ratio is calculated using the following formula: Payout Ratio = (Dividends per Share / Earnings per Share) * 100. This ratio expresses the proportion of a company's earnings paid out as dividends in percentage terms.
A high payout ratio indicates that a company is distributing a large portion of its earnings as dividends to shareholders. This may suggest a mature company with limited growth opportunities, but it could also raise concerns about the company's ability to support future growth or pay off debt if the payout ratio is consistently high.
A low payout ratio is not inherently better than a high one, as it depends on the investor's objectives and the specific company. A low payout ratio suggests that a company is retaining more earnings for growth and reinvestment, which might be attractive to growth investors. On the other hand, a high payout ratio may be appealing to income-oriented investors seeking regular dividend income.
While the payout ratio can provide valuable insights, it is essential to compare companies within the same industry for meaningful analysis. Payout ratios vary across industries due to differences in growth potential, capital requirements, and financial stability. Comparing industry-specific benchmarks can help investors assess a company's dividend policy and financial health relative to its peers.
True Tamplin is a published author, public speaker, CEO of UpDigital, and founder of Finance Strategists.
True is a Certified Educator in Personal Finance (CEPF®), author of The Handy Financial Ratios Guide, a member of the Society for Advancing Business Editing and Writing, contributes to his financial education site, Finance Strategists, and has spoken to various financial communities such as the CFA Institute, as well as university students like his Alma mater, Biola University, where he received a bachelor of science in business and data analytics.
To learn more about True, visit his personal website or view his author profiles on Amazon, Nasdaq and Forbes.


