In the context of technical analysis and financial markets, capitulation refers to the point when investors have decided to give up on any previous gains in security or market by selling their positions. This typically happens when a significant drop in the price of a financial instrument incites further selling, often at any price. This intense selling action frequently signals the end of a downward trend and the beginning of a new upward trend. Capitulation is often considered a sign of market bottom or exhaustion, as it suggests that most of the weak or fearful participants have exited the market. After capitulation, some traders and investors who were waiting for a bottom may start to see value in the depressed prices, leading to a potential reversal or a period of consolidation. In technical analysis, traders may look for signs of capitulation using various indicators such as extremely high trading volumes, spikes in volatility, or the formation of specific candlestick patterns. These indicators can help identify potential turning points in the market or specific securities, but it's important to note that market behavior can be unpredictable, and not all instances of capitulation lead to a lasting reversal or recovery. One of the significant hallmarks of capitulation is a drastic increase in selling pressure. As fear and panic grip investors, they rapidly offload their holdings to mitigate further losses, leading to a massive selling spree. This results in a substantial surge in trading volume, which is a key sign of capitulation. High volume, combined with a steep price decline, is a telling sign that the market may be entering a capitulation phase. Capitulation is typically associated with a severe and rapid decline in prices. This precipitous drop is often the result of panic selling, with investors eager to exit their positions, irrespective of the price. As this panic selling accelerates, prices can drop significantly in a relatively short period. Capitulation is not only about numbers; it also involves a shift in market sentiment. It is marked by overwhelming pessimism, with negative news and bearish forecasts dominating the media. This extreme bearish sentiment can push prices even lower, feeding into the cycle of fear and panic. Another noteworthy characteristic of capitulation is the eventual exhaustion of selling. Capitulation is the point of maximum financial opportunity precisely because it represents a moment where there are no more sellers left in the market. This extreme situation occurs because almost everyone who wanted to sell their positions has already done so. This clears the way for potential buyers, indicating a possible bottom and a subsequent reversal in the market trend. Oversold conditions, identified by technical indicators such as the Relative Strength Index (RSI) and the Stochastic Oscillator, suggest that a security is being traded at a price lower than its true value due to excessive selling. This discrepancy between price and value, coupled with a lack of sellers, often triggers a market reversal. Fear and panic play a significant role in capitulation. The steep fall in prices incites a sense of panic among investors who rush to sell their positions to avoid further losses. This panic selling exacerbates the decline, driving prices even lower. It is the manifestation of extreme fear and pessimism. Capitulation also highlights the herd mentality that often prevails in financial markets. As prices fall and negative news abounds, investors tend to follow the crowd in fear of being the last one to exit. The overwhelming desire to prevent further losses leads to irrational selling, which further feeds the cycle of fear and panic. Capitulation can be identified in market charts by observing an intense increase in volume accompanied by a sharp decline in prices. Analysts use various indicators such as the Volume Oscillator or On Balance Volume (OBV) to track and analyze volume trends. These indicators help identify periods of intense selling, signaling potential capitulation. During capitulation, prices typically drop drastically and swiftly. Charting tools like Bollinger Bands and Average True Range (ATR) can help identify these extreme price movements. Bollinger Bands, for instance, plot standard deviations above and below a moving average. Prices touching the lower band could indicate extreme selling and potential capitulation. The immediate aftermath of capitulation is usually a volatile and uncertain market environment. The intense selling has exhausted the bears, and the bulls are hesitant to enter. The market could experience wild price swings as it searches for a new equilibrium. In the long term, capitulation often signals the bottoming out of a market and the potential start of a new uptrend. After the intense selling pressure has subsided, bargain hunters typically enter the market, leading to a gradual increase in prices. However, it is essential to remember that not every capitulation leads to an immediate reversal. Sometimes, the market can consolidate or even continue its downward trend before eventually rebounding. Trading during capitulation requires a solid risk management strategy. This includes setting stop losses to limit potential downside and being prepared to exit positions if the market continues to decline. Furthermore, traders should be mindful of their position size, as high volatility could lead to significant losses. Despite the extreme fear and pessimism during capitulation, traders should not lose sight of market fundamentals. While technical analysis is crucial, understanding the underlying fundamentals can provide a clearer picture of the market's future direction. Traders should evaluate whether the intense selling is justified or if it is a potential overreaction to negative news. One of the potential advantages of trading during capitulation is the opportunity for high returns. If correctly identified, buying at the point of capitulation could lead to significant gains when the market rebounds. Capitulation often leads to overselling, resulting in prices falling below their intrinsic value. This creates an opportunity for traders to buy securities at bargain prices. Capitulation is often viewed as a potential market bottom. If this is the case, traders who enter at this point could benefit from the subsequent uptrend. While high volatility can be risky, it also provides more trading opportunities. The wide price swings during capitulation can be profitable for short-term traders and those using strategies like swing trading. In the event of a continued downtrend, the point of capitulation provides a clearer exit point for traders. This can help in risk management and loss minimization. Trading during capitulation carries a high level of risk. The extreme volatility could lead to substantial losses, especially for those who are unprepared or lack a solid risk management strategy. It is challenging to correctly time the market, especially during capitulation. It is nearly impossible to accurately predict the exact bottom of the market. Trading during capitulation can be emotionally stressful. The intense fear and panic in the market can lead to irrational decisions. There is a risk of false signals during capitulation. What may appear as capitulation could merely be a temporary pause in a continuing downtrend. Capitulation is often compared to other market bottom patterns such as double bottom, triple bottom, and rounded bottom. These patterns also signal a potential reversal in the market trend. However, unlike capitulation, these patterns form over a longer period and lack the intensity of fear and panic seen in capitulation. Like any other market pattern, capitulation should be used in conjunction with other technical analysis tools for validation. Tools like trend lines, moving averages, and momentum indicators can provide additional insights and help confirm potential market bottoms. For instance, a bullish divergence between price and a momentum indicator like the Relative Strength Index could reinforce the potential bottom signaled by capitulation. Capitulation is a significant event in financial markets that represents a point of extreme fear, panic, and selling pressure. It is characterized by a drastic increase in selling volume, accompanied by a sharp decline in prices. Capitulation often marks the end of a downward trend and can signal the beginning of a new upward trend. While trading during capitulation presents opportunities for high potential returns and buying at bargain prices, it also carries high risks, including difficulty in timing the market and the possibility of further decline. Traders should employ risk management techniques, consider market fundamentals, and use capitulation in conjunction with other technical analysis tools for validation. Capitulation is not the only market bottom pattern, and it should be compared to other reversal patterns such as double bottom, triple bottom, and rounded bottom. These patterns form over a longer period and lack the intensity of fear and panic seen in capitulation. Additionally, traders should use other technical analysis tools like trend lines, moving averages, and momentum indicators to confirm potential market bottoms signaled by capitulation.What Is Capitulation?
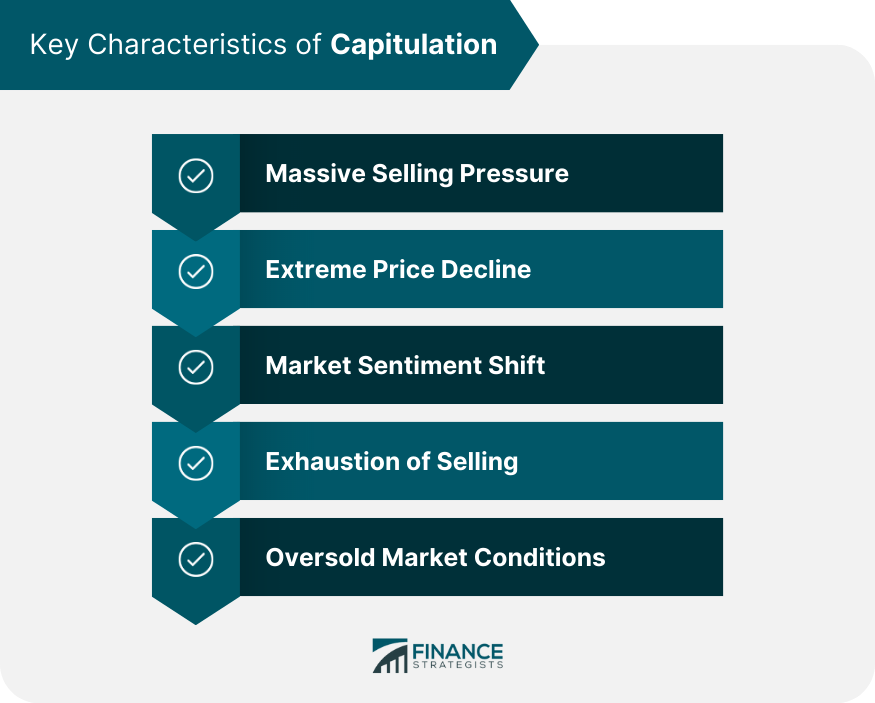
Key Characteristics of Capitulation
Massive Selling Pressure
Extreme Price Decline
Market Sentiment Shift
Exhaustion of Selling
Oversold Market Conditions

Psychological Aspects of Capitulation
Fear and Panic
Herd Mentality
Identifying Capitulation in Market Charts
Use of Volume and Price Indicators
Observing Extreme Price Movements
Effects of Capitulation on Market Trends
Short-Term Impact
Long-Term Implications
Trading Strategies During Capitulation
Risk Management Techniques
Market Fundamentals
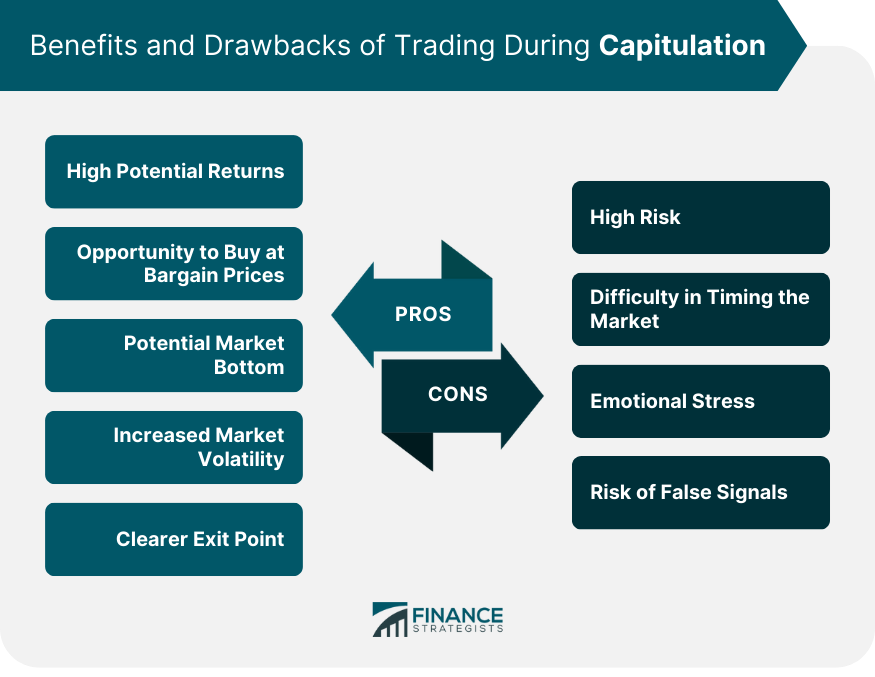
Benefits of Trading During Capitulation
High Potential Returns
Opportunity to Buy at Bargain Prices
Potential Market Bottom
Increased Market Volatility
Clearer Exit Point
Drawbacks of Trading During Capitulation
High Risk
Difficulty in Timing the Market
Emotional Stress
Risk of False Signals

Capitulation and Other Market Bottom Patterns
Comparison With Other Reversal Patterns
Use in Conjunction With Other Technical Analysis Tools
Final Thoughts
Capitulation FAQs
Trading during capitulation can offer high potential returns, as buying at the point of capitulation could lead to significant gains when the market rebounds. It also provides an opportunity to buy securities at bargain prices and potentially identify a market bottom.
Trading during capitulation carries a high level of risk due to extreme market volatility. There is a possibility of substantial losses if traders are unprepared or lack a solid risk management strategy. It is also challenging to accurately time the market and there is a risk of false signals during capitulation.
Risk management techniques are crucial during capitulation. Traders should set stop losses to limit potential downside and be prepared to exit positions if the market continues to decline. It is also important to consider position size, as high volatility can lead to significant losses.
Despite the extreme fear and pessimism during capitulation, traders should not lose sight of market fundamentals. Understanding the underlying fundamentals can provide a clearer picture of the market's future direction and help evaluate whether the intense selling is justified or an overreaction to negative news.
Capitulation can be identified by observing an intense increase in volume accompanied by a sharp decline in prices. Analysts use indicators such as the Volume Oscillator or On Balance Volume (OBV) to track and analyze volume trends. Extreme price movements, indicated by charting tools like Bollinger Bands and Average True Range (ATR), can also suggest capitulation.
True Tamplin is a published author, public speaker, CEO of UpDigital, and founder of Finance Strategists.
True is a Certified Educator in Personal Finance (CEPF®), author of The Handy Financial Ratios Guide, a member of the Society for Advancing Business Editing and Writing, contributes to his financial education site, Finance Strategists, and has spoken to various financial communities such as the CFA Institute, as well as university students like his Alma mater, Biola University, where he received a bachelor of science in business and data analytics.
To learn more about True, visit his personal website or view his author profiles on Amazon, Nasdaq and Forbes.


