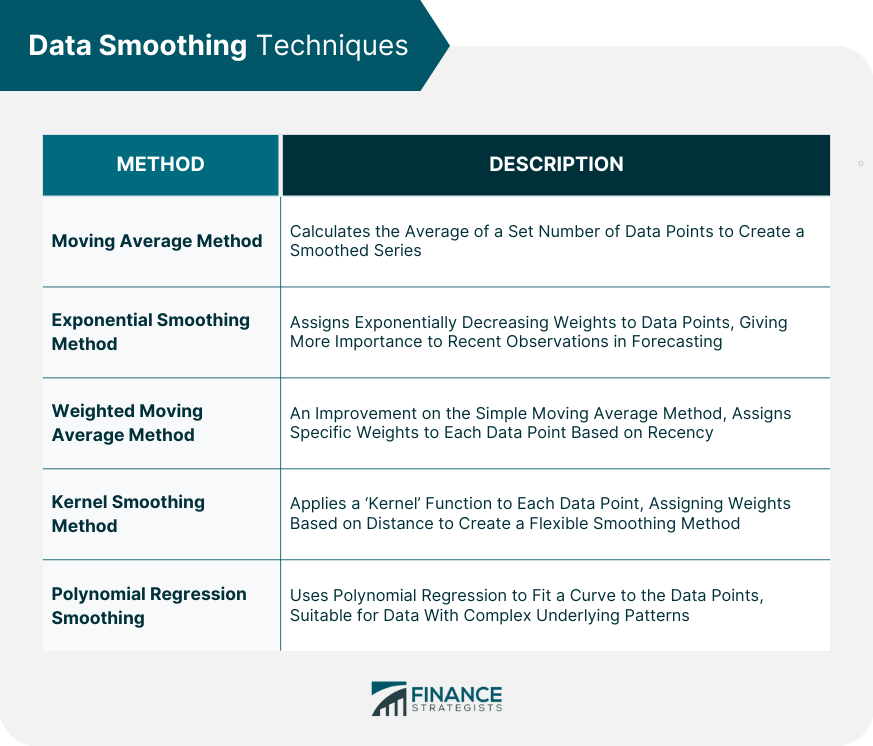
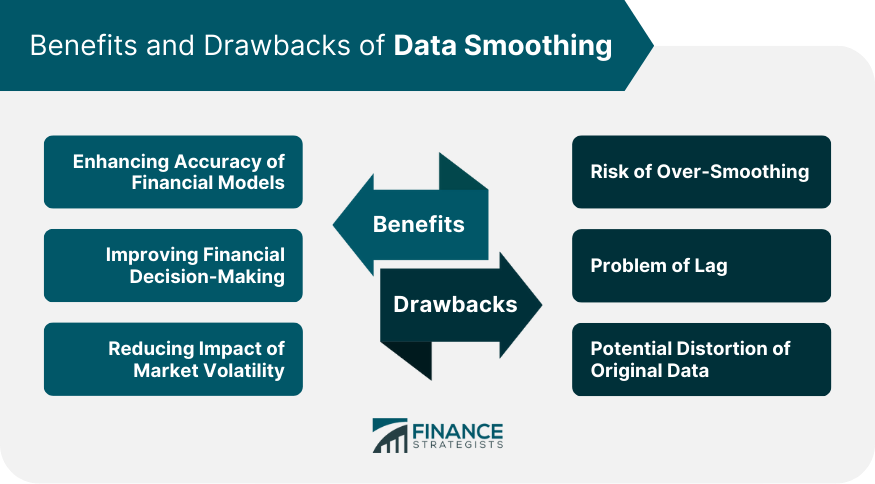
Data smoothing, at its core, refers to the process of eliminating noise or fluctuations from data sets to clarify trends or patterns. In the financial world, the vast amounts of data that are generated every day can be noisy, irregular, or even chaotic, with minor fluctuations potentially obscuring the broader patterns. Hence, data smoothing becomes crucial for meaningful analysis and decision-making. Data smoothing operates as a technique to remove random short-term fluctuations or 'noise' from time-series data. This results in an output that reveals underlying trends, patterns, or cyclical components more clearly, thereby improving the quality of the data for subsequent analysis. Data smoothing helps in identifying trends obscured by random noise and aids in predicting future trends, assisting decision-makers in making informed choices. It can smooth out price volatility, reveal hidden patterns in revenue streams, or even help identify fraudulent financial activity. Data smoothing goes beyond merely filtering noise—it is about refining raw data to extract valuable insights that inform business decisions. Noise in financial data primarily refers to random or erratic fluctuations that do not reflect the underlying trend or pattern. These can arise from a variety of sources like market volatility, human error, or technological glitches. Noise can distort financial analysis and lead to incorrect or misleading conclusions. Data smoothing becomes necessary in financial analysis as it helps isolate the actual trends from the noise. This, in turn, leads to more accurate and insightful analyses, facilitating more precise forecasting and strategic decision-making. There are several data smoothing techniques commonly used in financial analysis, each with its advantages and disadvantages. The moving average method is one of the simplest and most popular data smoothing techniques. It involves taking the average of a set number of data points, thereby creating a new series of averages that smooth out short-term fluctuations. Exponential smoothing assigns exponentially decreasing weights to data points as they become more distant in time. This method places greater emphasis on more recent observations, making it especially useful in forecasting when recent trends are more reflective of future performance. This technique is an improvement on the simple moving average method. In the weighted moving average method, each data point is assigned a specific weight, with more recent data typically given more weight. Kernel smoothing is a more complex but flexible method. It applies a 'kernel' function to each data point, which assigns weights to observations based on their distance from the point being smoothed. This method uses polynomial regression to fit a curve to the data points. It's a powerful smoothing technique, particularly suitable for data with more complex underlying patterns. Data smoothing techniques are widely applied across various facets of financial analysis. In stock market analysis, data smoothing helps in recognizing long-term trends in stock prices, despite daily or weekly volatility. Traders and investors often use smoothed data to make buying or selling decisions. In financial forecasting, smoothed historical data can lead to more accurate projections. This can improve everything from budgeting to cash flow management to strategic planning. In risk management, data smoothing can aid in identifying and quantifying financial risks, enabling organizations to take proactive steps to mitigate potential harm. Data smoothing can confer a multitude of benefits when employed in financial analysis. By removing random noise, data smoothing can increase the accuracy of financial models, leading to more reliable forecasts and analyses. By revealing hidden trends and patterns, smoothed data can provide more actionable insights, which can result in better-informed decision-making. Data smoothing can reduce the impact of market volatility on analysis, ensuring that temporary fluctuations do not distort long-term trends or strategic decisions. While data smoothing offers many benefits, it also comes with some potential pitfalls. Over-smoothing occurs when too much data smoothing removes not just noise, but also important information from the data set, leading to inaccurate analyses. Data smoothing can introduce a lag, especially when using methods that heavily weigh more recent observations. This delay can distort real-time analysis and decision-making. Data smoothing, especially when inappropriately applied, can distort the original data, potentially leading to misleading conclusions. Data smoothing refers to techniques used to remove short-term fluctuations or 'noise' from time-series data to reveal underlying trends, patterns, or cyclical components more clearly. Various techniques such as moving average, exponential smoothing, weighted moving average, kernel smoothing, and polynomial regression smoothing are commonly employed in financial analysis to achieve data smoothing. By enhancing the accuracy of financial models, improving decision-making, and reducing the impact of market volatility, data smoothing provides numerous benefits. However, it is important to be cautious of potential drawbacks such as the risk of over-smoothing, the problem of lag, and the potential distortion of original data. It is beneficial to seek guidance from financial professionals with expertise in data analysis.What is Data Smoothing?
Understanding the Concept of Data Smoothing
Role of Noise in Financial Data
Necessity for Data Smoothing
Data Smoothing Techniques
Moving Average Method
Exponential Smoothing Method
Weighted Moving Average Method
Kernel Smoothing Method
Polynomial Regression Smoothing

Application of Data Smoothing in Financial Analysis
Stock Market Analysis
Financial Forecasting
Risk Management
Benefits of Data Smoothing in Finance
Enhancing Accuracy of Financial Models
Improving Financial Decision-Making
Reducing Impact of Market Volatility
Drawbacks of Data Smoothing
Risk of Over-Smoothing
Problem of Lag
Potential Distortion of Original Data

Final Thoughts
Data smoothing plays a crucial role in financial analysis by eliminating noise and revealing underlying trends and patterns. It enables decision-makers to make informed choices, predict future trends, and identify fraudulent activity.
Data Smoothing FAQs
Data smoothing is a technique used to remove random short-term fluctuations or 'noise' from time-series data to reveal underlying trends, patterns, or cyclical components more clearly.
Data smoothing is important in financial analysis because it improves the quality of financial data, making it easier to spot trends and make accurate forecasts.
Common data smoothing techniques include the moving average method, exponential smoothing method, weighted moving average method, kernel smoothing method, and polynomial regression smoothing.
Applications of data smoothing in financial analysis include stock market analysis, financial forecasting, and risk management.
The pitfalls of data smoothing include the risk of over-smoothing, the problem of lag, and potential distortion of the original data.
True Tamplin is a published author, public speaker, CEO of UpDigital, and founder of Finance Strategists.
True is a Certified Educator in Personal Finance (CEPF®), author of The Handy Financial Ratios Guide, a member of the Society for Advancing Business Editing and Writing, contributes to his financial education site, Finance Strategists, and has spoken to various financial communities such as the CFA Institute, as well as university students like his Alma mater, Biola University, where he received a bachelor of science in business and data analytics.
To learn more about True, visit his personal website or view his author profiles on Amazon, Nasdaq and Forbes.


