The Double Exponential Moving Average is an advanced technical indicator that provides a smoother and faster moving average by removing the inherent lag associated with traditional moving averages. It was developed by Patrick Mulloy and first published in the "Technical Analysis of Stocks & Commodities" magazine in 1994. The DEMA calculation involves a single and double exponential moving average resulting in a faster reaction to price changes than the simple moving average (SMA) or the standard exponential moving average (EMA). Mulloy's DEMA is a composite of a single and double exponential moving average, which offers superior responsiveness to market shifts. This new technical analysis tool quickly gained popularity among traders and financial analysts due to its accuracy and predictive capabilities. The DEMA is a reliable tool to predict price movements and identify trading opportunities. It helps traders to understand market trends and make informed decisions. Its fast reactivity makes it particularly useful in volatile markets, where traditional moving averages may lag. Moreover, the DEMA is commonly used in algorithmic trading systems due to its efficiency and accuracy in generating trading signals. Its versatility has seen it integrated into numerous trading strategies across various financial markets. The exponential moving average is a type of moving average that gives more weight to recent data points. It calculates the average price of a security over a specified period, like the SMA, but it adjusts more quickly to price changes. The EMA is part of the DEMA calculation. Calculating the DEMA involves three primary steps: The time period used in the DEMA calculation plays a vital role in its responsiveness to price changes. A shorter time period will make the DEMA more responsive to price changes, while a longer time period will make it less responsive but potentially more stable. One of the main characteristics of the DEMA is its high reactivity to price changes. This allows it to provide faster and more accurate signals compared to other moving averages. Compared to the SMA and EMA, the DEMA provides a smoother and more accurate representation of the price trend. While the SMA and EMA tend to lag behind the actual price, the DEMA reduces this lag significantly, providing traders with timely and actionable information. The DEMA incorporates a smoothing factor that helps to reduce noise and false signals. This makes it a reliable tool for identifying the underlying trend and making informed trading decisions. In stock market trading, the DEMA is often used to generate buy and sell signals. A common strategy is to buy when the price crosses above the DEMA and sell when it crosses below. The DEMA can also be used to identify potential support and resistance levels. Many trading strategies incorporate the DEMA as a key component. For example, the DEMA can be combined with other technical indicators to form a comprehensive trading system. Such strategies can provide more accurate signals, leading to potentially higher profitability. Forex traders also use the DEMA to identify potential trading opportunities. Similar to stock trading, forex traders often buy when the price crosses above the DEMA and sell when it crosses below. The DEMA can also be used to identify trend reversals, providing valuable insights for forex trading. The DEMA responds quicker to price changes than other types of moving averages. This means traders can potentially enter or exit trades sooner, maximizing profitability. The DEMA is often more accurate in tracking the price of an asset, making it a reliable tool for traders and investors alike. The DEMA can be used in various financial markets, including stocks, forex, and futures. This makes it a versatile tool for traders and analysts. The DEMA helps to reduce market noise, providing a smoother representation of the price trend. This makes it easier to identify true market trends. Due to its accuracy and speed, the DEMA is often incorporated in algorithmic trading systems, helping to automate trading decisions. Like any technical indicator, the DEMA can generate false signals, particularly in volatile or sideways markets. It's crucial to use the DEMA in conjunction with other technical indicators to confirm signals. The DEMA calculation is more complex compared to other moving averages. This complexity may be daunting for beginner traders. Some traders might over-rely on the DEMA, neglecting other crucial market indicators. It's essential to use the DEMA as part of a comprehensive trading strategy. The DEMA's responsiveness to price changes can be a double-edged sword. Choosing an inappropriate time period can lead to excessive sensitivity to minor price fluctuations, leading to false signals. The Double Exponential Moving Average is an advanced technical indicator that offers traders and investors a smoother and faster-moving average compared to traditional moving averages. Developed by Patrick Mulloy, the DEMA quickly gained popularity for its accuracy and predictive capabilities in tracking price trends. Its reactivity to price changes makes it valuable in volatile markets, and it has found practical applications in stock market trading, trading strategies, and forex trading. DEMA provides several benefits, including its speed in responding to price changes, accuracy in tracking asset prices, versatility across different financial markets, and noise reduction capabilities. Its integration into algorithmic trading systems further highlights its efficiency and effectiveness. However, traders should be aware of potential drawbacks, such as false signals, complexity in calculation, the risk of overreliance, and sensitivity to the chosen time period. To maximize the benefits of DEMA, traders are encouraged to combine it with other technical indicators and use it as part of a comprehensive trading strategy. With its ability to provide timely and actionable information, the DEMA remains a valuable tool for market participants seeking to make informed trading decisions.What Is the Double Exponential Moving Average (DEMA)?
Calculating the DEMA
Basic Concept of EMA
Detailed Steps in Calculating DEMA
1. Calculate the EMA: The first step involves calculating the EMA for a specified period. The EMA gives more weight to recent data, making it more responsive to price changes.
2. Calculate the Double EMA: This involves calculating the EMA of the previously calculated EMA, thus the term double EMA.
3. Calculate the DEMA: The DEMA is calculated by subtracting the double EMA from twice the value of the original EMA. The resulting value is the DEMA.
Role of Time Period in DEMA Calculation
Characteristics of DEMA
Reactivity to Price Changes
DEMA vs SMA and EMA
Smoothing Factor in DEMA
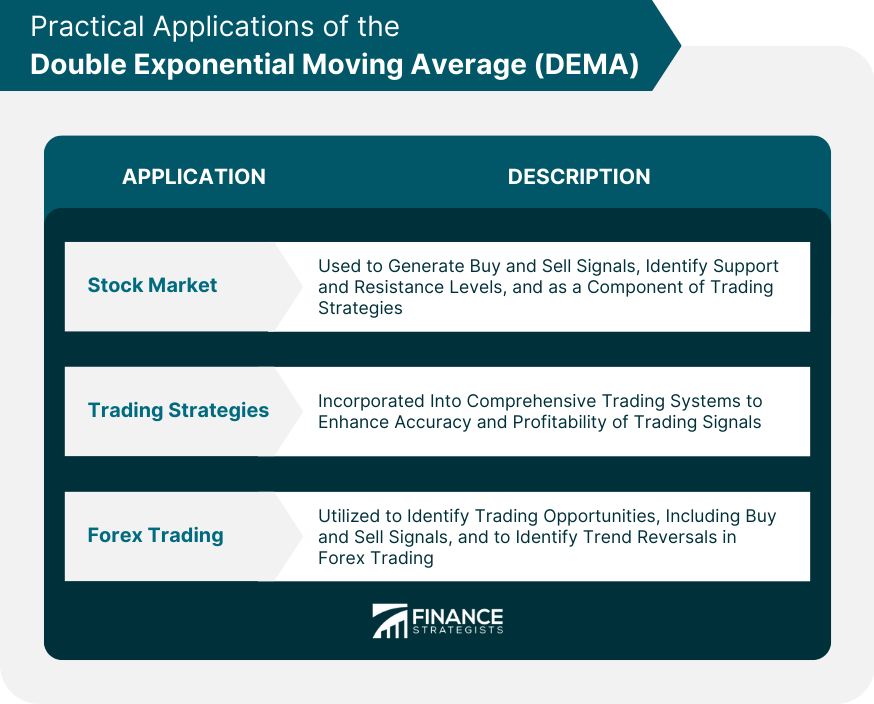
Practical Applications of DEMA
Stock Market Trading
As a Component of Trading Strategies
Forex Trading

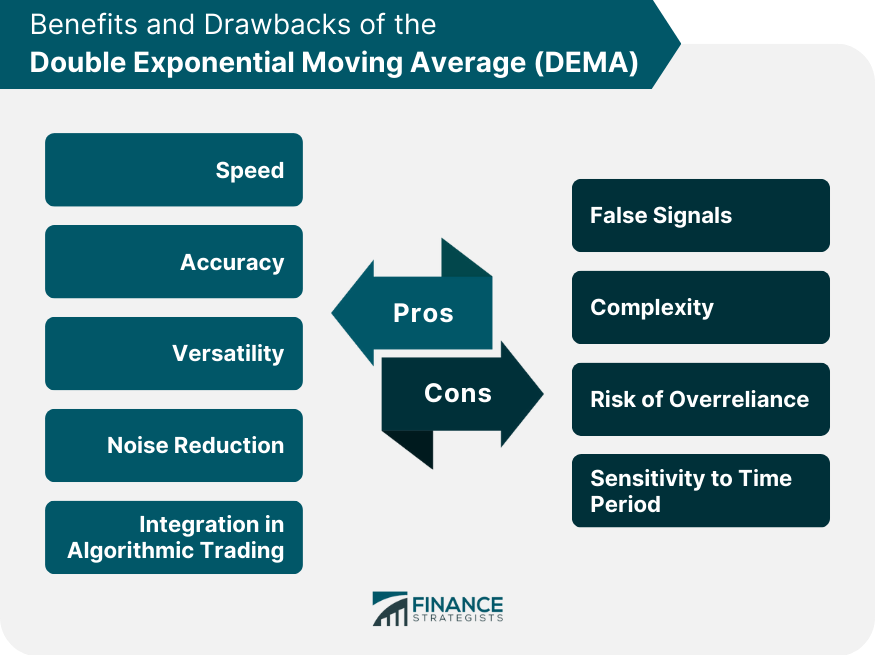
Benefits of DEMA
Speed
Accuracy
Versatility
Noise Reduction
Integration in Algorithmic Trading
Drawbacks of DEMA
False Signals
Complexity
Risk of Overreliance
Sensitivity to Time Period

Final Thoughts
Double Exponential Moving Average FAQs
The DEMA offers a smoother and faster-moving average compared to traditional moving averages. It reduces lag, providing quicker responses to price changes and generating more timely signals for traders.
A common strategy is to buy when the price crosses above the DEMA and sell when it crosses below. This crossover technique can help identify potential entry and exit points in the market.
Yes, DEMA can be applied to various markets, including stocks, forex, and futures. Its versatility makes it a useful tool for traders in different asset classes.
Like any technical indicator, DEMA can generate false signals, especially in volatile or sideways markets. It is recommended to use DEMA in conjunction with other indicators and incorporate it into a comprehensive trading strategy.
While DEMA offers advantages in terms of responsiveness and accuracy, its calculation can be more complex compared to simpler moving averages. Beginner traders may need to familiarize themselves with the concept and consider starting with basic moving averages before incorporating DEMA into their analysis.
True Tamplin is a published author, public speaker, CEO of UpDigital, and founder of Finance Strategists.
True is a Certified Educator in Personal Finance (CEPF®), author of The Handy Financial Ratios Guide, a member of the Society for Advancing Business Editing and Writing, contributes to his financial education site, Finance Strategists, and has spoken to various financial communities such as the CFA Institute, as well as university students like his Alma mater, Biola University, where he received a bachelor of science in business and data analytics.
To learn more about True, visit his personal website or view his author profiles on Amazon, Nasdaq and Forbes.


