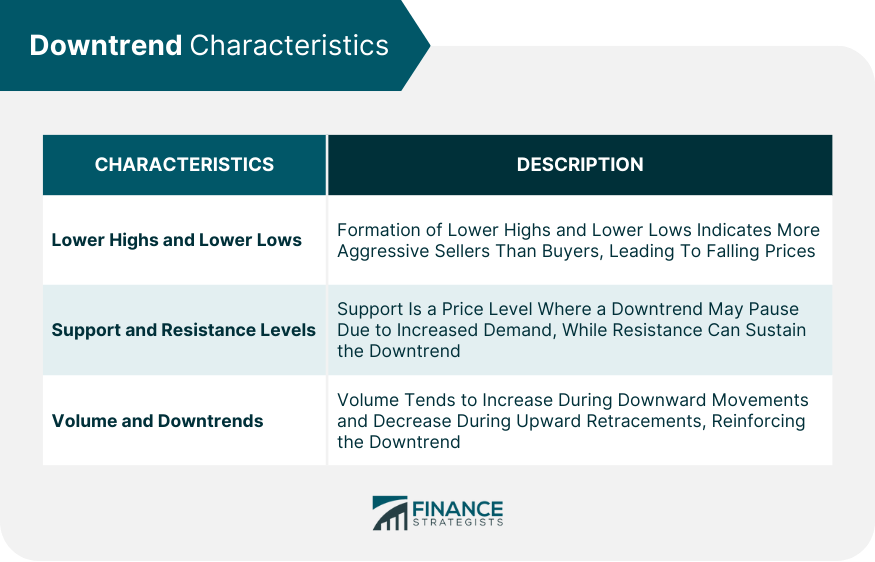
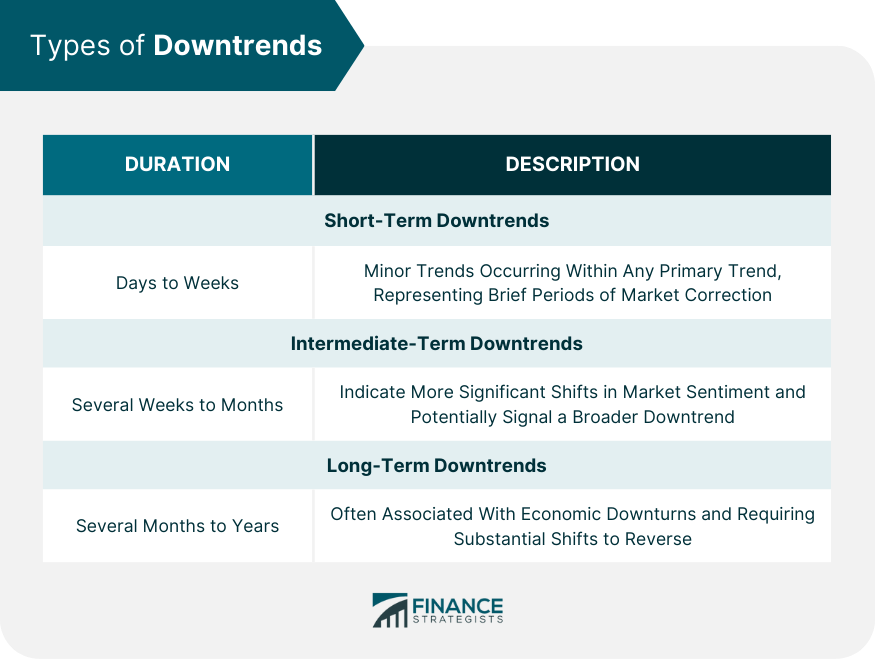
A downtrend refers to a general decline in a security's price over a specific period, often marked by a series of lower highs and lower lows. It is a significant aspect of the bearish market phase where pessimism and selling predominate. Understanding downtrends is crucial for both traders and investors. It helps in risk management by indicating when to sell or avoid a particular security. Moreover, certain trading strategies, like short-selling, directly capitalize on downtrends, generating profits when prices fall. Trend analysis forms the basis of technical analysis, a method used to examine and predict price movements based on historical data. A downtrend is one of the three major types of trends recognized in this analysis, the other two being uptrend and sideways (or horizontal) trend. Analyzing downtrends enables traders to capitalize on falling prices or protect their investments. It aids in determining exit points for long positions or entry points for short positions. Additionally, understanding downtrends is essential for implementing hedging strategies during bearish market phases. A key characteristic of a downtrend is the formation of lower highs and lower lows. This pattern indicates that sellers are more aggressive than buyers, causing prices to continue falling. Support is a price level at which a downtrend may pause due to increased demand. Resistance, conversely, is a price level at which a downtrend might continue due to increased supply. Traders often use these levels to make buying or selling decisions. In a downtrend, volume tends to increase during downward movements and decrease during upward retracements. This pattern shows that the selling pressure is stronger than the buying pressure, thus reinforcing the downtrend. Short-term downtrends, also known as minor trends, typically last for days to weeks. They can occur within any primary trend (up, down, or sideways) and often represent brief periods of market correction. Intermediate-term downtrends generally persist for several weeks to months. They represent more significant shifts in market sentiment and may signal the start of a broader, long-term downtrend. Long-term downtrends, or primary downtrends, can last from several months to years. These persistent declines often accompany or indicate economic downturns, and they require substantial shifts in market sentiment or economic conditions to reverse. Moving averages smooth out price data to identify trends over specific periods. A simple moving average (SMA) crossover, where a shorter-term SMA crosses below a longer-term SMA, can signal a downtrend. Trendlines are lines drawn above the price action in a downtrend. They connect the lower highs and act as a line of resistance, helping to confirm the downtrend. RSI is a momentum oscillator that measures the speed and change of price movements. In a downtrend, the RSI typically remains below 50, and often dips below 30, indicating oversold conditions. Certain price patterns, such as head and shoulders, double tops, and descending triangles, can signal a downtrend. These patterns are recognized by technical analysts as reliable bearish signals. Short selling involves borrowing shares to sell them at a high price, with the expectation of buying them back at a lower price. It's a common strategy for profiting from downtrends. Buying put options gives the right, but not the obligation, to sell a security at a specific price within a certain time. If the security's price falls, the put increases in value, making it an effective strategy for downtrends. Stop-loss orders can protect against excessive losses during downtrends. A stop-loss order automatically sells a security when it reaches a predetermined price, limiting losses if the price continues to fall. Diversification reduces risk by spreading investments across various financial instruments, sectors, or geographic regions. It can mitigate potential losses in a downtrend, particularly for long-term investors. An increase in volume during upward price movements may signal a potential downtrend reversal, as it could indicate a stronger buying pressure. A break of the downtrend's resistance trendline, especially when accompanied by high volume, often signals a trend reversal. Some traders may buy a security in a downtrend if they anticipate a reversal. However, this strategy carries significant risk, as the downtrend may continue longer than expected. Waiting for confirmation, such as a trendline break or bullish price pattern, reduces risk. However, it may result in missing out on the initial part of the new uptrend. Long-term downtrends often accompany economic downturns, which reduce GDP. A falling stock market can decrease consumer and business sentiment, leading to reduced spending and investment. During downtrends, companies may experience lower revenues and profits, leading to layoffs and higher unemployment rates. Downtrends can lead to decreased demand for goods and services, potentially leading to lower inflation. However, the relationship between inflation and stock market trends is complex and influenced by numerous factors. The global financial crisis triggered a severe downtrend, with major stock indices losing over 50% of their value. The crisis demonstrated the significant economic effects of prolonged downtrends, including recession, high unemployment, and global financial instability. The COVID-19 pandemic triggered a rapid, but relatively short-lived, downtrend. Despite initial heavy losses, aggressive monetary and fiscal policies helped markets rebound quickly, demonstrating the potential for policy intervention to mitigate downtrends. A downtrend refers to a general decline in a security's price over a specific period, characterized by lower highs and lower lows. It is an important concept for traders and investors as it provides insights into market sentiment and can guide risk management decisions. Understanding downtrends allows for the identification of selling or short-selling opportunities, enabling traders to capitalize on falling prices. Additionally, analyzing downtrends aids in determining exit points for long positions and entry points for short positions, while also facilitating the implementation of hedging strategies during bearish market phases. Technical analysis tools such as moving averages, trendlines, RSI, and price patterns are valuable in identifying and confirming downtrends. Trading strategies such as short selling and put options are commonly used to profit from downtrends, while risk management techniques like stop-loss orders and diversification help mitigate potential losses. Furthermore, recognizing signs of downtrend reversals, such as changes in volume and breaks of trendlines, can guide traders in adjusting their strategies accordingly. It is important to note that major downtrends can have significant impacts on economic indicators such as GDP, unemployment rates, and inflation, as demonstrated by examples like the Global Financial Crisis and the COVID-19 pandemic market downturn. Overall, understanding and effectively navigating downtrends is essential for market participants to make informed decisions and manage their portfolios successfully.What Is a Downtrend?
Understanding the Concept of Downtrends
Trend Analysis
Importance of Downtrend Analysis
Downtrend Characteristics
Lower Highs and Lower Lows
Support and Resistance Levels
Volume and Downtrends

Types of Downtrends
Short-Term Downtrends
Intermediate-Term Downtrends
Long-Term Downtrends

Identifying a Downtrend
Use of Technical Analysis Tools
Moving Averages
Trendlines
Relative Strength Index (RSI)
Price Patterns
Trading in a Downtrend
Strategies for Trading
Short Selling
Put Options
Risk Management in Downtrends
Stop-Loss Orders
Diversification
Downtrend Reversals
Signs of Reversal
Change in Volume
Break of Trendline
Trading Strategies for Downtrend Reversals
Buying in Anticipation of a Reversal
Waiting for Confirmation of a Reversal
Impact of Downtrends on Economic Indicators
Gross Domestic Product (GDP)
Unemployment Rates
Inflation
Examples of Major Downtrends
The Global Financial Crisis (2007-2008)
COVID-19 Pandemic Market Downtrend (2020)
Final Thoughts
Downtrend FAQs
Short-term downtrends, also known as minor trends, typically last for days to weeks, representing brief periods of market correction.
Intermediate-term downtrends generally last for several weeks to months, indicating more significant shifts in market sentiment and potentially signaling the start of a broader, long-term downtrend.
Technical analysis tools commonly used to identify downtrends include moving averages, trendlines, the Relative Strength Index (RSI), and recognition of bearish price patterns such as head and shoulders, double tops, and descending triangles.
Traders can profit from downtrends through strategies like short selling, which involves borrowing shares to sell them at a high price with the expectation of buying them back at a lower price. Another strategy is buying put options, which gives the right to sell a security at a specific price within a certain time.
Investors can protect themselves during downtrends by implementing risk management techniques such as using stop-loss orders, which automatically sell a security when it reaches a predetermined price. Diversification is also key, spreading investments across various instruments, sectors, or regions to mitigate potential losses in a downtrend.
True Tamplin is a published author, public speaker, CEO of UpDigital, and founder of Finance Strategists.
True is a Certified Educator in Personal Finance (CEPF®), author of The Handy Financial Ratios Guide, a member of the Society for Advancing Business Editing and Writing, contributes to his financial education site, Finance Strategists, and has spoken to various financial communities such as the CFA Institute, as well as university students like his Alma mater, Biola University, where he received a bachelor of science in business and data analytics.
To learn more about True, visit his personal website or view his author profiles on Amazon, Nasdaq and Forbes.


