A Dragonfly Doji is a candlestick pattern that is formed when the opening and closing prices of an asset are at or near the same level, and the high and low prices for that period are also close together. It is called a "Dragonfly" because it resembles the insect’s shape with its long lower shadow and a short or no upper shadow. The Dragonfly Doji is considered a bullish reversal pattern when it appears after a downtrend. It suggests that the selling pressure has weakened, and buyers are stepping in, pushing the price back up. The long lower shadow indicates that prices fell significantly during the trading period but managed to close near the opening level or higher. This can be a sign of a potential trend reversal or a support level. The formation of the Dragonfly Doji candlestick pattern is an intricate process determined by several market conditions. The Dragonfly Doji pattern forms when the open, high, and close prices of a security are virtually the same, and the low is significantly lower than these three prices. It occurs at the bottom of a downtrend, signalling a possible change in the market sentiment. The Dragonfly Doji is characterized by a long lower shadow (or wick) and no upper shadow, with the opening and closing prices at the high of the day. This pattern suggests that during a trading session, the security’s price fell significantly but recovered by the end of the session to close near the opening price. This buying pressure is an indication of potential bullish reversal. In the Dragonfly Doji, the Open, High, Low, Close prices carry important implications. Open and close are at the high of the trading period, illustrating a strong comeback by the bulls. The low, on the other hand, shows how far the bears were able to push the price down before the trend reversed. The Dragonfly Doji candlestick is typically seen after a series of bearish candles in a downtrend. Its presence indicates that the bears may be losing their grip on the market and a reversal could be imminent. Volume plays an essential role during the formation of a Dragonfly Doji. A surge in volume during the pattern's formation provides extra confirmation of a potential bullish reversal, as it suggests increased buying pressure. While the Dragonfly Doji is a powerful pattern, it shares similarities with other candlestick patterns like the Hammer and the Hanging Man. The distinction lies in the previous trend and subsequent price action which are key in understanding the correct interpretation of these patterns. The Dragonfly Doji is an indication of market indecision. The lack of a real body (the part of the candlestick between the open and close prices) indicates that there is a tug-of-war between buyers and sellers, with neither able to gain the upper hand. More significantly, the Dragonfly Doji serves as a potential reversal signal. When appearing after a prolonged downtrend, it suggests that the selling pressure may be waning and a bullish reversal could be on the horizon. While the Dragonfly Doji is primarily considered a bullish signal, its interpretation should always take into account the larger market context. It's crucial to understand the prevailing market conditions and other technical indicators before drawing any concrete conclusions based on this single candlestick pattern. The Dragonfly Doji can help traders identify potential opportunities for long positions. For instance, a trader could consider entering a long position after the appearance of a Dragonfly Doji at the end of a downtrend, particularly if this is confirmed by other bullish signals. In terms of risk management, the low of the Dragonfly Doji can serve as an excellent stop-loss level. If the price dips below this level, it may indicate that the reversal signal was false. On the other hand, take-profit levels can be set by looking at previous resistance levels or using price projection techniques. The Dragonfly Doji can play a significant role in diversifying trading strategies. Incorporating this pattern into an existing trading strategy can add another layer of analysis and further improve the accuracy of the trader's market predictions. Like any trading tool, the Dragonfly Doji is not foolproof. It may occasionally produce false reversal signals, where the price doesn't reverse as expected after the pattern's formation. Traders should always seek additional confirmation from other technical indicators to validate the signals generated by the Dragonfly Doji. Confirmation of a Dragonfly Doji could come in various forms. For example, a bullish candlestick that closes above the high of the Dragonfly Doji the following day could serve as a strong confirmation signal. Other forms of confirmation could be a break above resistance levels or the appearance of bullish divergence on an oscillator like the RSI or MACD. Broader market factors and news events can significantly influence the price action following the appearance of a Dragonfly Doji. Even the most convincing Dragonfly Doji pattern can be rendered ineffective in the face of significant news events or market volatility. Hence, traders should always stay updated with the latest market news and economic developments. For a more robust trading strategy, traders can combine the Dragonfly Doji with other technical indicators. For instance, a Dragonfly Doji followed by a bullish divergence in the RSI could be a strong buy signal. Alternatively, a Dragonfly Doji near a major support level could provide an additional confirmation of a potential bullish reversal. The Dragonfly Doji is also finding its place in the world of algorithmic trading. Many trading algorithms are programmed to identify the Dragonfly Doji and execute trades based on this pattern, ensuring traders can capitalize on potential opportunities even when they aren't actively monitoring the markets. The Dragonfly Doji can be a useful tool in multi-time frame analysis. Traders could use it to spot potential reversal points in the market on a longer time frame and then drop down to a shorter time frame to refine their entries and exits. The Dragonfly Doji candlestick pattern is a valuable tool for technical analysis in financial markets. When appearing after a downtrend, it suggests a potential bullish reversal, indicating that selling pressure is diminishing and buyers are entering the market. However, traders should exercise caution and consider other technical indicators and market conditions for confirmation before making trading decisions based solely on the Dragonfly Doji pattern. While the Dragonfly Doji offers insights into market indecision and potential reversals, it is not infallible and can produce false signals. Traders should be mindful of the limitations and pitfalls associated with this pattern and seek additional confirmation from other indicators. Furthermore, combining the Dragonfly Doji with other technical tools, employing algorithmic trading strategies, and conducting multi-time frame analysis can enhance the effectiveness and accuracy of trading decisions. By incorporating the Dragonfly Doji pattern into their analysis, traders can gain a deeper understanding of market sentiment and potentially improve their trading outcomes.What Is a Dragonfly Doji Candlestick?
Formation of the Dragonfly Doji Candlestick
Prerequisites for Formation
Anatomical Elements and Their Significance
Understanding the Open, High, Low, Close (OHLC)
Dragonfly Doji Candlesticks in Market Context
Role of Prevailing Trend
Significance of Volume During Formation
Comparison With Other Candlestick Patterns
Interpretation of the Dragonfly Doji Candlestick
Indication of Market Indecision
Potential Reversal Signal
Considerations in Bullish and Bearish Markets
Practical Applications of Dragonfly Doji Candlesticks in Trading
Identifying Opportunities for Long Positions
Use in Risk Management
Diversifying Trading Strategies
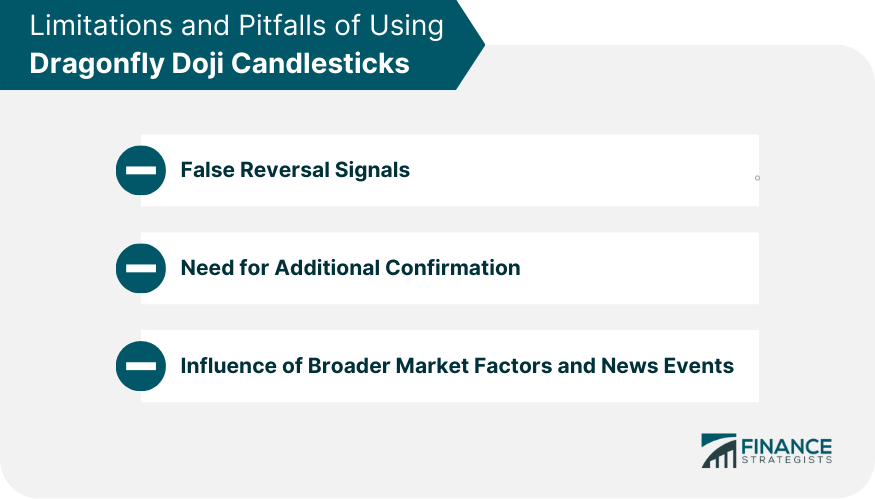
Limitations and Pitfalls of Using Dragonfly Doji Candlesticks
False Reversal Signals
Need for Additional Confirmation
Influence of Broader Market Factors and News Events

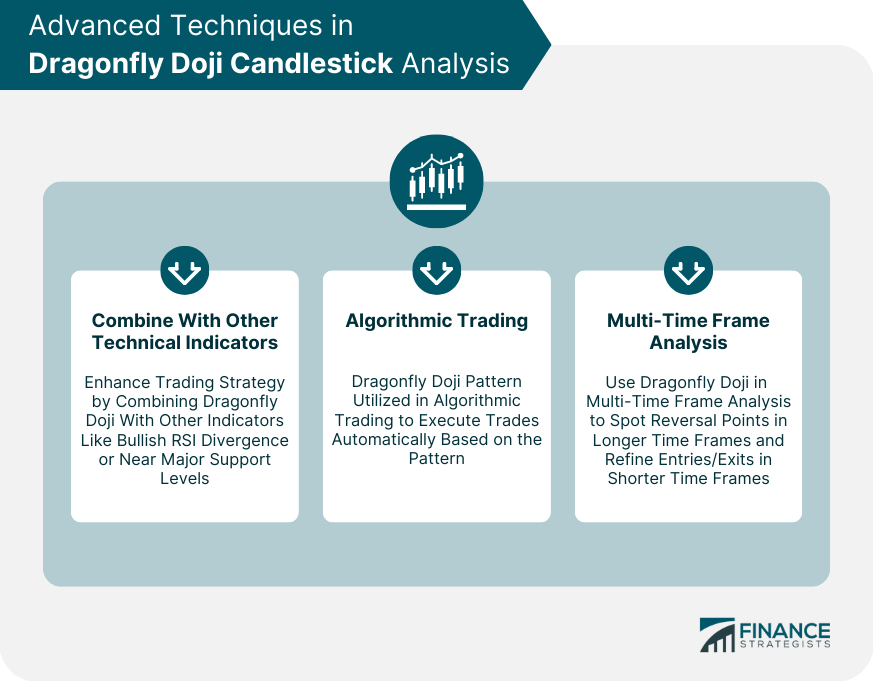
Advanced Techniques in Dragonfly Doji Candlestick Analysis
Combine With Other Technical Indicators
Algorithmic Trading
Multi-Time Frame Analysis

Final Thoughts
Dragonfly Doji Candlestick FAQs
The Dragonfly Doji pattern is significant as it suggests a potential bullish reversal in the market. It indicates that selling pressure has weakened and buyers are stepping in, potentially leading to an upward trend.
Traders should interpret the Dragonfly Doji pattern as a signal of market indecision and a potential trend reversal. However, it is essential to consider other technical indicators and market conditions for confirmation before making trading decisions.
Yes, the Dragonfly Doji pattern has limitations. It can occasionally produce false reversal signals, and its effectiveness can be influenced by broader market factors and news events. Traders should always stay updated with the latest market news and consider additional confirmation tools.
Absolutely. Combining the Dragonfly Doji pattern with other technical indicators can strengthen trading strategies. Traders often use it in conjunction with indicators like the RSI (Relative Strength Index) or MACD (Moving Average Convergence Divergence) for additional confirmation.
Yes, the Dragonfly Doji pattern can be incorporated into algorithmic trading strategies. Many trading algorithms are programmed to identify and execute trades based on this pattern, enabling traders to capitalize on potential opportunities even when they are not actively monitoring the markets.
True Tamplin is a published author, public speaker, CEO of UpDigital, and founder of Finance Strategists.
True is a Certified Educator in Personal Finance (CEPF®), author of The Handy Financial Ratios Guide, a member of the Society for Advancing Business Editing and Writing, contributes to his financial education site, Finance Strategists, and has spoken to various financial communities such as the CFA Institute, as well as university students like his Alma mater, Biola University, where he received a bachelor of science in business and data analytics.
To learn more about True, visit his personal website or view his author profiles on Amazon, Nasdaq and Forbes.


