The Evening Star is a bearish candlestick pattern that signifies a potential reversal in a bullish market. It consists of three candles: a long bullish candle, followed by a short candle or a doji that gaps above the previous candle, and finally a long bearish candle that falls into the body of the first candle. Named for the planet Venus which appears in the sky just before sunrise, the Evening Star is an essential part of Japanese candlestick charting techniques. This technique has gained widespread popularity among Western traders due to its ability to illustrate the emotion and sentiment of market participants. The Evening Star pattern is a crucial tool for traders as it aids in identifying the potential end of a bullish trend, helping traders to make more informed decisions. Its appearance often leads to a shift in market sentiment, alerting traders to exit long positions or even initiate short positions. The Evening Star pattern begins with a large bullish candle, which is indicative of the continuation of an existing bullish trend. This candle is typically accompanied by high trading volume, showing strong buying interest. The second candle is a smaller one, which can also be a doji, meaning a candle where opening and closing prices are virtually the same. This candle gaps above the first candle, demonstrating a decrease in momentum. The third candle in the Evening Star pattern is a large bearish candle that falls into the body of the first candle, signifying the reversal of the bullish trend. The closing price of this candle should be at least halfway down the body of the first candle. Market psychology plays a crucial role in the formation of the Evening Star pattern. Initially, the first bullish candle demonstrates strong buying interest. However, the small or doji candle that follows signals uncertainty, reflecting a shift in sentiment where buyers begin to question the longevity of the bullish trend. By the formation of the third candle, sellers dominate the market, driving prices lower and confirming a bearish reversal. The transition from bullish to bearish sentiment is embodied in the Evening Star pattern. This pattern demonstrates a story of bullish confidence being gradually eroded and replaced by bearish sentiment. The initial bullish momentum is replaced by indecision (second candle), and finally, bearish sentiment takes over (third candle), symbolizing a potential trend reversal. The Morning Star pattern is the bullish counterpart of the Evening Star. It consists of a long bearish candle, followed by a small or doji candle that gaps below the first candle, and a long bullish candle that rises into the body of the first candle. This pattern indicates a potential bullish reversal in a previously bearish trend. In a Morning Star pattern, market sentiment transitions from bearish to bullish. Initially, the bearish sentiment is strong, as depicted by the first candle. However, the sentiment becomes uncertain by the second candle, showing potential exhaustion among sellers. By the third candle, buyers regain control, driving prices higher and establishing a bullish reversal. In stock trading, the Evening Star pattern is used to identify potential tops in a stock price during an uptrend. When an Evening Star pattern is spotted, it may signal to traders to close long positions or consider shorting the stock, expecting the price to fall. In currency markets, the Evening Star pattern can be an effective tool for identifying reversals in trending currency pairs. Since forex markets operate 24 hours, they allow for more candlestick patterns to form, providing more opportunities for the appearance of the Evening Star. Commodity traders also use the Evening Star pattern to identify potential price reversals. This can be particularly useful in markets like oil or gold, which are known for their price trends. Given the high volatility and strong trends often observed in cryptocurrency markets, the Evening Star pattern can be used to identify potential trend reversals in various digital currencies. In binary options trading, an Evening Star pattern can be used to place a 'put option' (a bet that the price will fall) on a particular asset. The expiry of the option can be set based on the timeframe of the chart being used. The pattern helps in setting stop loss levels. Once an Evening Star pattern is confirmed, traders can place a stop loss above the high of the pattern. This exit strategy allows traders to limit potential losses if the price doesn’t fall as expected. One of the most significant drawbacks of the Evening Star pattern is the possibility of false signals. A false signal refers to a situation where the pattern appears to predict a bearish trend reversal, but the bullish trend continues instead. This misinterpretation can lead traders to make incorrect trading decisions, potentially resulting in financial losses. The effectiveness of the Evening Star pattern can vary based on market conditions. For instance, during periods of low volatility or in a thinly traded market, the pattern may not be as reliable. Similarly, in a highly volatile market, the pattern might appear but the expected reversal may not occur or may be delayed. The Evening Star pattern usually needs to be confirmed by subsequent trading periods to verify a bearish reversal. Traders often look for a significant gap down or a long black candle as a follow-up confirmation. This need for confirmation can delay trading decisions, possibly causing traders to miss the optimal entry point for a short position. While the Evening Star pattern indicates a possible trend reversal, it provides no insight into how significant this reversal will be. The subsequent downtrend could be short-lived or turn into a prolonged bearish phase. Traders must use other technical analysis tools to estimate the potential magnitude and duration of the trend reversal. Sometimes, the interpretation of the Evening Star pattern can be subjective. Slight differences in the pattern’s formation can lead to disagreements among traders about whether a valid Evening Star pattern has formed. For instance, there might be a debate on whether the star (second candle) has gapped sufficiently from the surrounding candles. The Evening Star pattern, with its iconic three-candle structure, serves as an invaluable tool for traders across various markets. Whether applied in equity, forex, commodities, cryptocurrencies, or binary options trading, it presents a visual representation of market sentiment transitioning from bullish to bearish, thereby indicating potential trend reversals. By understanding its psychological underpinnings—namely the shift from bullish optimism to increasing uncertainty and eventually to dominant bearish sentiment—traders can employ this signal to make more informed trading decisions, like exiting long positions or initiating short ones. Nevertheless, the Evening Star pattern also comes with limitations and potential pitfalls. Traders should be wary of false signals, varying effectiveness based on market conditions, the need for confirmation, an inability to predict the magnitude of the trend reversal, and the subjectivity of interpretation. It is therefore essential that the Evening Star pattern be used in conjunction with other technical analysis tools to make robust trading decisions.What Is the Evening Star?
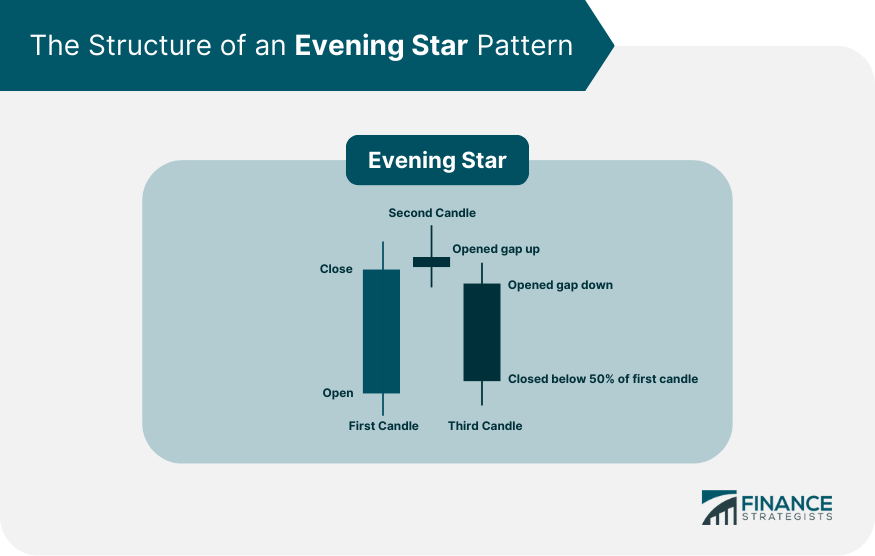
Structure of an Evening Star Pattern
First Candle: A Large Bullish Candle
Second Candle: A Smaller Candle or Doji
Third Candle: A Large Bearish Candle

Evening Star and Market Psychology
Investor Sentiments During the Formation of the Pattern
Transition From Bullish to Bearish Sentiment
Differences Between the Evening Star and Morning Star
Comparing the Structures
Identifying the Market Sentiments
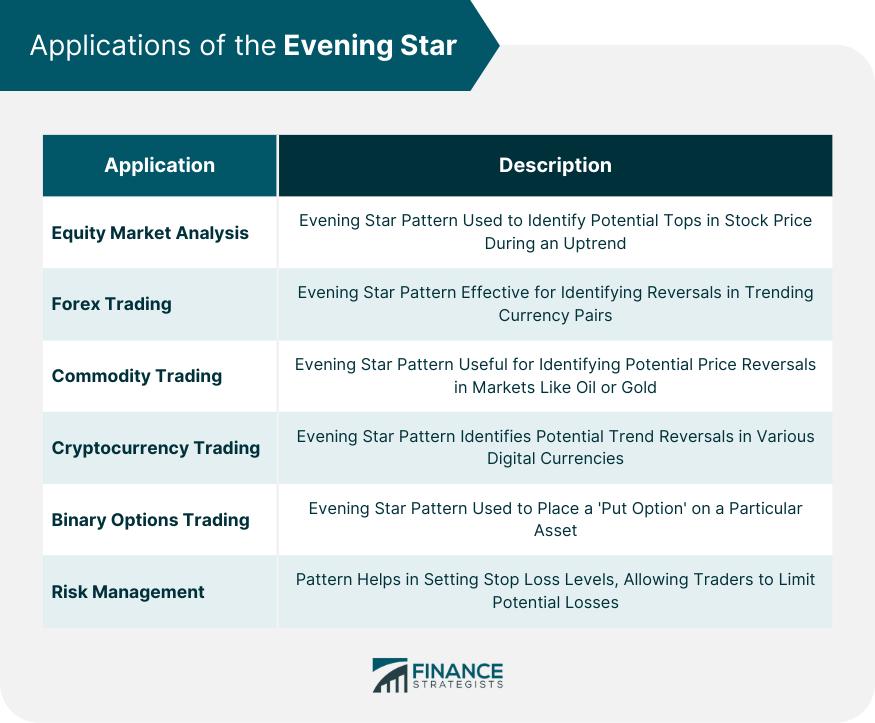
Applications of the Evening Star
Equity Market Analysis
Forex Trading
Commodity Trading
Cryptocurrency Trading
Binary Options Trading
Risk Management

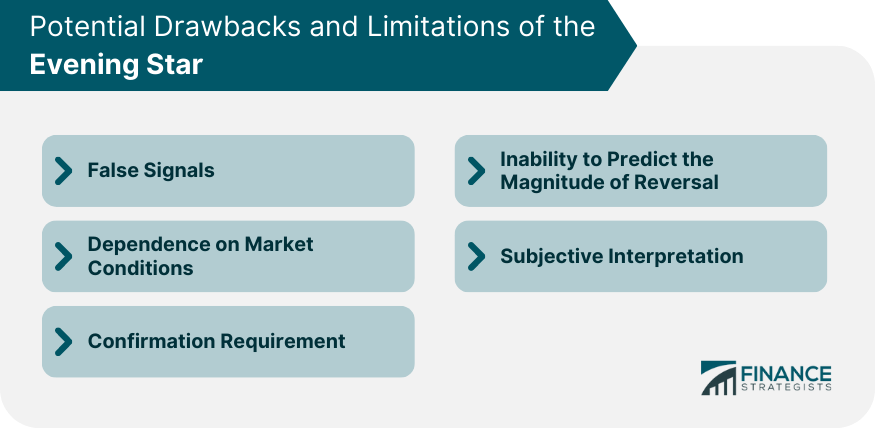
Potential Drawbacks and Limitations of the Evening Star
False Signals
Dependence on Market Conditions
Confirmation Requirement
Inability to Predict the Magnitude of Reversal
Subjective Interpretation

Final Thoughts
Evening Star FAQs
The Evening Star pattern is a bearish candlestick pattern used in technical analysis to predict a potential reversal in a bullish market. It consists of three candles: a long bullish candle, followed by a short candle or a doji that gaps above the first candle, and finally a long bearish candle that falls into the body of the first candle. This pattern indicates a shift from a bullish to a bearish market sentiment.
The Evening Star pattern can be used across various trading markets. In equity trading, it can identify potential tops in a stock price during an uptrend. In forex and commodity markets, it can help spot reversals in trending currency pairs and commodities respectively. The pattern is also applicable in the highly volatile cryptocurrency market for identifying trend reversals. In binary options trading, it can be used to place a 'put option' on a particular asset.
Market psychology plays a crucial role in the formation of the Evening Star pattern. The first bullish candle indicates strong buying interest, but the small or doji candle that follows signals uncertainty and a shift in sentiment where buyers begin to question the longevity of the bullish trend. By the formation of the third candle, sellers dominate the market, driving prices lower and confirming a bearish reversal.
The Evening Star pattern does come with some limitations. These include the possibility of false signals, varying effectiveness based on market conditions, a requirement for confirmation, an inability to predict the magnitude of the trend reversal, and subjectivity of interpretation. Hence, it is recommended that this pattern should be used in combination with other technical analysis tools.
The Evening Star pattern aids in risk management by helping set stop loss levels. Once an Evening Star pattern is confirmed, traders can place a stop loss above the high of the pattern. This strategy allows traders to limit potential losses if the price doesn’t fall as expected following the pattern.
True Tamplin is a published author, public speaker, CEO of UpDigital, and founder of Finance Strategists.
True is a Certified Educator in Personal Finance (CEPF®), author of The Handy Financial Ratios Guide, a member of the Society for Advancing Business Editing and Writing, contributes to his financial education site, Finance Strategists, and has spoken to various financial communities such as the CFA Institute, as well as university students like his Alma mater, Biola University, where he received a bachelor of science in business and data analytics.
To learn more about True, visit his personal website or view his author profiles on Amazon, Nasdaq and Forbes.


