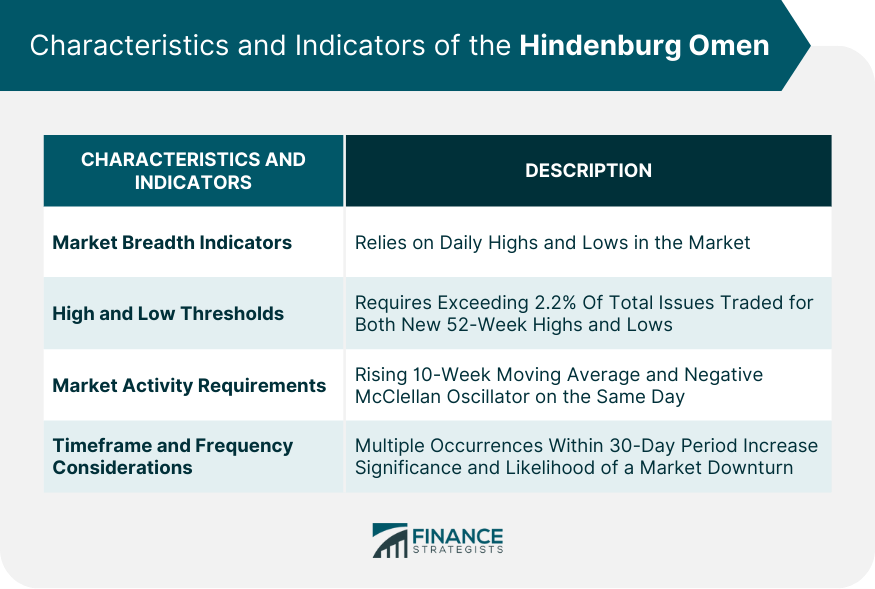
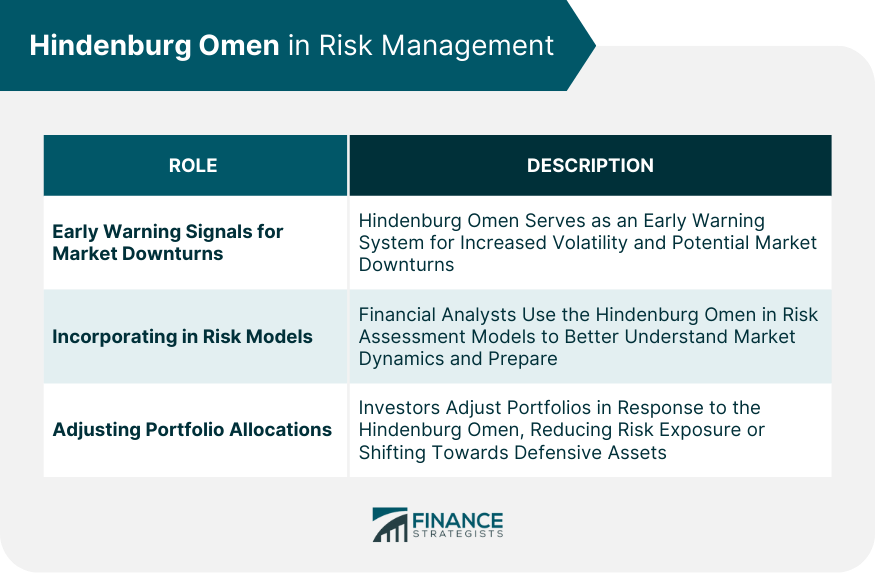
The Hindenburg Omen is a technical analysis pattern, named after the infamous Hindenburg disaster of 1937. The pattern is believed to forecast stock market crashes or significant downturns. This complex market indicator is based on the number of securities that form new highs relative to the number making new lows, the market’s momentum, and the extent of securities participation in the market trend. The Omen suggests the presence of underlying market instability and increasing likelihood of a stock market crash when the market is characterized by a high level of divergence or disorganization. This lack of uniformity is seen as an indication of confusion and uncertainty among investors, setting the stage for increased volatility and potential downturn. The Hindenburg Omen is viewed as a tool that can potentially warn investors and traders of upcoming market volatility, allowing them to adjust their strategies accordingly. The Hindenburg Omen's workings are rooted in its specific criteria. For it to be triggered, several conditions related to market breadth and momentum must be simultaneously satisfied. These criteria include the number of new daily highs and lows in the market exceeding a certain threshold, and the market index remaining above the value it had 50 days ago. Additionally, the Menzie-Dickey Full Parameter Test, or MCO, another component of the Hindenburg Omen, is required to be negative. This combination of factors is believed to indicate a lack of consensus among investors, signaling potential market instability. The Hindenburg Omen is unique in its focus on market breadth rather than individual security prices. It essentially attempts to provide a snapshot of the market's overall health, relying on the assumption that a healthy market will see a majority of its components moving in the same direction. The Hindenburg Omen primarily relies on market breadth indicators, particularly the numbers of new daily highs and lows in the market. Market breadth refers to how broad the participation in a market trend is. When both new highs and new lows exceed their respective thresholds, it indicates divergence and lack of direction in the market, a condition necessary for the Hindenburg Omen. In terms of specific thresholds, the traditional interpretation of the Hindenburg Omen requires the number of new 52-week highs and the number of new 52-week lows on the New York Stock Exchange to both be greater than 2.2 percent of the total issues traded that day. The exact percentage can vary, but the key point is that both highs and lows should be significantly elevated. Beyond the high-low requirements, additional conditions must be met for the Hindenburg Omen to be triggered. The NYSE 10-week moving average should be rising, and the McClellan Oscillator, a measure of market breadth based on advancing and declining issues, should be negative on the same day. In terms of timeframe and frequency, the Hindenburg Omen is typically considered more significant when it occurs multiple times within a 30-day period. The multiple occurrences are seen as reinforcing the signal and increasing the likelihood of a market downturn. The Hindenburg Omen is calculated using several components. It starts with the number of new 52-week highs and lows in the market, comparing these figures to the total number of securities traded. It also considers the direction of the 10-week moving average of the NYSE, expecting it to be rising. The final component is the McClellan Oscillator, a momentum indicator derived from the number of advancing and declining issues on the NYSE, which should be negative on the same day the other conditions are met. Once all these conditions are met, a Hindenburg Omen signal is generated. It is interpreted as a warning sign of an upcoming market crash or significant downturn. However, it's crucial to remember that while the Hindenburg Omen has been associated with some past market crashes, it has also produced false signals, and its predictive ability remains a subject of debate among market participants. Strictly speaking, the Hindenburg Omen is confirmed when the conditions mentioned above occur twice within a 30-day period. Some analysts use a tighter window of multiple occurrences within a 36-day period. The specifics can vary, but the key point is that multiple signals within a close timeframe are typically seen as confirming the Hindenburg Omen and increasing the chances of a market downturn. Despite its limitations, the Hindenburg Omen can serve as one of many tools in an investor's risk management toolbox. Its main utility lies in its potential as an early warning system for increased market volatility and potential downturns. When the Omen is triggered, risk-averse investors may choose to move towards safer investments or hedge their positions. Investors and financial analysts can incorporate the Hindenburg Omen into their risk assessment models. By doing so, they can develop a broader understanding of market dynamics and prepare for potential market downturns. This is not to say that the Hindenburg Omen should be the sole determinant of investment decisions, but rather that it can form a part of a comprehensive risk management strategy. Upon the appearance of the Hindenburg Omen, investors might choose to adjust their portfolio allocations. This could mean reducing exposure to riskier assets, increasing positions in defensive stocks or sectors, or even moving towards cash or cash equivalents. The Hindenburg Omen is a technical analysis indicator used in finance to predict potential stock market crashes or volatility. It takes into account various market breadth indicators and their relationship to market activity. It relies on specific criteria, including the number of stocks reaching new highs and lows simultaneously, to generate a signal. High and low thresholds for these indicators are considered significant in determining the presence of the Hindenburg Omen. When the Hindenburg Omen occurs, it suggests an increased likelihood of market instability. Traders and investors interpret this signal as a warning of potential market downturns or increased volatility. The Hindenburg Omen plays a crucial role in risk management strategies. It provides early warning signals of potential market downturns, allowing investors to adjust their portfolio allocations accordingly. Incorporating the Hindenburg Omen into risk assessment models helps identify and mitigate potential risks associated with market volatility.What Is the Hindenburg Omen?
How Does the Hindenburg Omen Work?
Key Characteristics and Indicators of the Hindenburg Omen
Market Breadth Indicators Used in the Hindenburg Omen
High and Low Thresholds for Market Breadth Indicators
Market Activity Requirements for the Hindenburg Omen to Occur
Timeframe and Frequency Considerations for the Hindenburg Omen

Interpretation of the Hindenburg Omen
Components Used to Calculate the Hindenburg Omen
Interpreting the Hindenburg Omen Signal
Thresholds and Criteria for Confirming the Hindenburg Omen
Role of the Hindenburg Omen in Risk Management Strategies
Early Warning Signals for Potential Market Downturns
Incorporating the Hindenburg Omen Into Risk Assessment Models
Adjusting Portfolio Allocations Based on Hindenburg Omen Signals

Conclusion
Hindenburg Omen FAQs
The Hindenburg Omen is a technical analysis pattern that is believed to forecast stock market crashes. It's based on the number of securities forming new highs relative to those making new lows, market momentum, and the extent of securities participation in the market trend.
The Hindenburg Omen is triggered when a set of conditions related to market breadth and momentum are simultaneously met. These conditions include the number of new daily highs and lows in the market exceeding a certain threshold, and the market index being above the value it had 50 days ago.
The Hindenburg Omen relies on market breadth indicators, particularly the number of new daily highs and lows in the market. It also requires the NYSE 10-week moving average to be rising, and the McClellan Oscillator, a measure of market momentum, to be negative on the same day.
When the Hindenburg Omen is triggered, it is interpreted as a warning sign of an upcoming market crash or significant downturn. However, it has given false signals in the past, and its predictive ability remains a subject of debate.
Despite its limitations, the Hindenburg Omen can serve as an early warning system for increased market volatility and potential downturns. Investors may choose to move towards safer investments, hedge their positions, adjust their portfolio allocations, or incorporate it into their risk assessment models when the Omen is triggered.
True Tamplin is a published author, public speaker, CEO of UpDigital, and founder of Finance Strategists.
True is a Certified Educator in Personal Finance (CEPF®), author of The Handy Financial Ratios Guide, a member of the Society for Advancing Business Editing and Writing, contributes to his financial education site, Finance Strategists, and has spoken to various financial communities such as the CFA Institute, as well as university students like his Alma mater, Biola University, where he received a bachelor of science in business and data analytics.
To learn more about True, visit his personal website or view his author profiles on Amazon, Nasdaq and Forbes.


