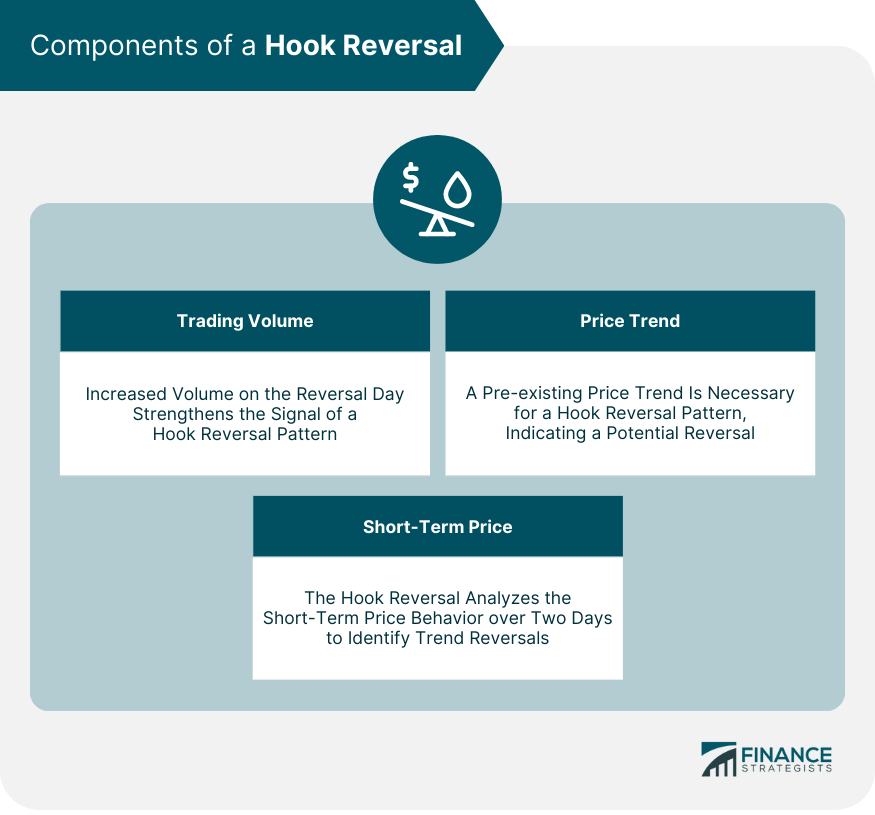
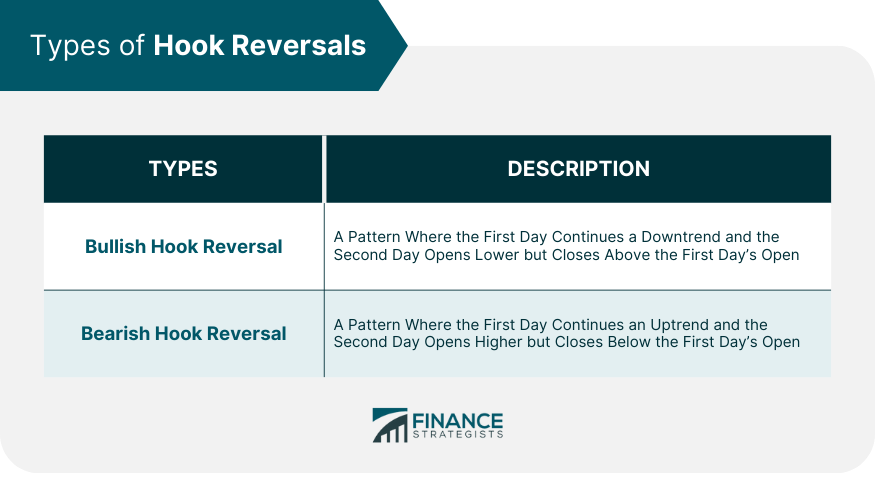
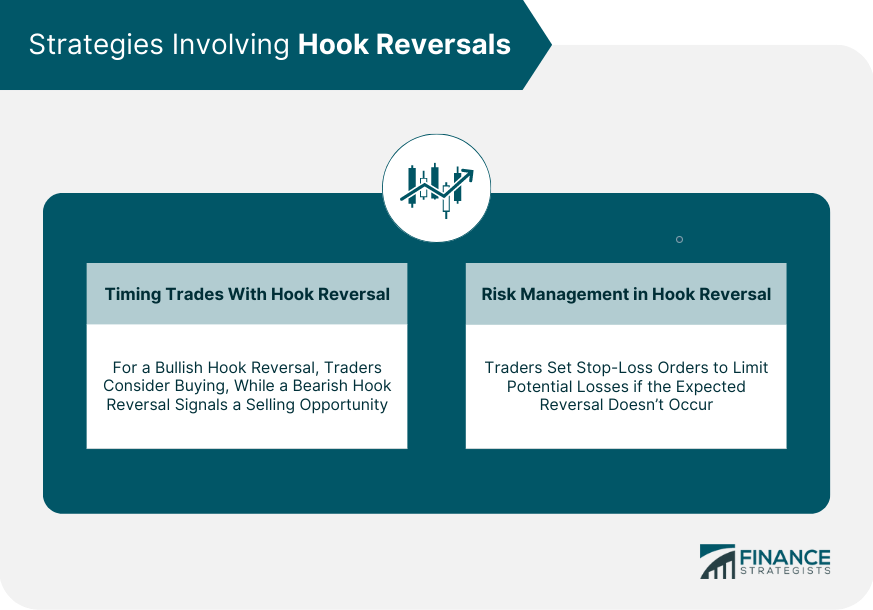
Hook Reversal is a two-day trading pattern used in technical analysis to predict potential reversals in market trends. The pattern, which forms a 'hook-like' shape on a candlestick chart, indicates a potential change from an existing price trend either upward or downward based on short-term price behavior and trading volume. Key components include the first day's price movement aligning with the current trend and the second day's price reversing but not closing beyond the previous day's high or low. Despite being a powerful predictive tool, Hook Reversal has its limitations and risks. Not every pattern guarantees a trend reversal and there's potential for misinterpretation. It's crucial to consider the overall market context and corroborate with other technical indicators and fundamental data to avoid the pitfalls of relying solely on Hook Reversal for trading decisions. A Hook Reversal is a crucial element of technical analysis in financial trading. Essentially, it is a pattern in a candlestick chart that signals the possible reversal of a trend. This reversal pattern provides essential cues for traders to determine when to buy or sell an asset, and understanding its fundamentals can significantly improve trading results. A Hook Reversal pattern is a two-day trading pattern. The first day of the pattern is in sync with the current trend, while the second day reverses and closes beyond the previous day's opening. However, it does not close beyond the previous day's high or low, creating a 'hook-like' pattern. In technical analysis, the Hook Reversal pattern serves as an indicator for potential market reversals. Its occurrence helps traders anticipate a change in price direction and adapt their trading strategies accordingly. However, this pattern's predictive power lies in its correct identification, which requires a keen understanding of its components. The Hook Reversal pattern encompasses several key components that provide the basis for its interpretation. In a Hook Reversal pattern, trading volume plays a significant role. An increase in volume on the day of the reversal suggests a stronger signal. Hence, tracking volume can assist in confirming the pattern. Before the appearance of a Hook Reversal, there must be an existing price trend - either upward or downward. The pattern indicates the potential reversal of this prevailing trend. The Hook Reversal also focuses on the short-term price behavior of a financial instrument. It involves monitoring the open, high, low, and close prices over a two-day period. To effectively use Hook Reversal in trading strategies, it is vital to understand the underlying mechanisms that contribute to its occurrence. Hook Reversal is typically caused by changes in market sentiment. If the market participants start to lose faith in the current trend, this may result in a reversal. Factors influencing this change can be diverse, ranging from broader market dynamics to specific news about the financial instrument in question. The appearance of a Hook Reversal can shift market dynamics, leading to new trends. The pattern essentially indicates a change in the balance of supply and demand for a financial instrument, which in turn can significantly affect its price. Depending on the preceding trend and the subsequent potential reversal, Hook Reversal patterns can be of two types. A bullish Hook Reversal occurs during a downtrend. On the first day, the price continues to drop, consistent with the trend, and on the second day, it opens lower but closes above the first day's opening. Conversely, a bearish Hook Reversal appears during an uptrend. On the first day, the price continues to rise in line with the trend. On the second day, it opens higher but closes below the first day's opening. Being adept at reading candlestick charts is paramount for identifying Hook Reversal patterns. Here's how to identify them in bullish and bearish trends. In a bullish trend, traders should look for a Hook Reversal pattern indicating a potential downturn. This pattern will exhibit a high opening price on the second day, followed by a close below the previous day's opening. In a bearish trend, a Hook Reversal will suggest a potential upward shift. The pattern will show a low opening price on the second day, with the closing price ending up above the previous day's opening. Implementing Hook Reversal into trading strategies can be an effective way to capitalize on potential market reversals. Traders often use Hook Reversal patterns to time their trades. Once the pattern is identified, traders can decide to enter or exit positions, anticipating the price change. As with any trading strategy, risk management is crucial when using Hook Reversal patterns. Traders can set stop-loss orders to limit potential losses if the expected reversal doesn't occur. Despite being a powerful tool, relying solely on Hook Reversal can pose certain risks. Understanding these can help traders employ the pattern more effectively. One of the main challenges in using Hook Reversal is the risk of misinterpretation. Not every Hook Reversal guarantees a trend reversal. Traders must consider other technical analysis indicators to confirm the pattern. Relying solely on Hook Reversal patterns can lead to missed opportunities or false signals. It's crucial to consider the overall market context, including other technical analysis indicators and fundamental data when basing decisions on these patterns. The Hook Reversal is an essential element in technical analysis that provides a potential indicator for market reversals. The pattern is distinguished by certain key components, such as trading volume, price trend, and short-term price behavior, that inform its interpretation. While it offers valuable insights, it's crucial to remember that like any analytical tool, it carries certain risks and limitations. Misinterpretations of Hook Reversal patterns can lead to incorrect trading decisions, and an overreliance can potentially miss broader market dynamics. Therefore, although the Hook Reversal is a powerful tool for predicting trend reversals, it should not be used in isolation. What Is a Hook Reversal?
Understanding the Concept of Hook Reversals
What Constitutes a Hook Reversal
Significance of Hook Reversals in Technical Analysis
Components of a Hook Reversal
Trading Volume
Price Trend
Short-Term Price Behavior

The Mechanics of Hook Reversals
Types of Hook Reversals

Hook Reversal Bullish Pattern
Hook Reversal Bearish Pattern
Reading Hook Reversals in Candlestick Charts
Identifying Hook Reversals in Bullish Trends
Spotting Hook Reversals in Bearish Trends
Strategies Involving Hook Reversals

Timing Trades With Hook Reversals
Risk Management in Hook Reversals
Limitations and Risks of Using a Hook Reversal
Misinterpretations of Hook Reversals
Potential Pitfalls of Relying on Hook Reversals
Conclusion
Its use should be complemented by other technical indicators and fundamental analysis to form a comprehensive trading strategy, leading to more informed decisions in the ever-changing landscape of financial markets.
Hook Reversal FAQs
A Hook Reversal is a two-day trading pattern used in technical analysis to predict potential reversals in market trends. The pattern appears on a candlestick chart and indicates a possible change from an existing price trend.
The main components of a Hook Reversal are the price trend, trading volume, and short-term price behavior. A Hook Reversal requires an existing price trend, and it involves monitoring the open, high, low, and close prices over a two-day period.
A Hook Reversal can help traders decide when to enter or exit trades by anticipating a price change. In a bullish Hook Reversal, traders may consider buying, while a bearish Hook Reversal could suggest a selling opportunity.
Despite being a powerful tool, Hook Reversal has its limitations and risks. Not every pattern guarantees a trend reversal and there's potential for misinterpretation. It's crucial to corroborate Hook Reversal with other technical indicators and fundamental data to avoid basing decisions solely on this pattern.
Future technological advancements, such as artificial intelligence and machine learning, could potentially improve the identification and interpretation of Hook Reversal patterns by analyzing vast amounts of data quickly and accurately. However, increased algorithmic trading and other market developments could also affect the predictability of these patterns.
True Tamplin is a published author, public speaker, CEO of UpDigital, and founder of Finance Strategists.
True is a Certified Educator in Personal Finance (CEPF®), author of The Handy Financial Ratios Guide, a member of the Society for Advancing Business Editing and Writing, contributes to his financial education site, Finance Strategists, and has spoken to various financial communities such as the CFA Institute, as well as university students like his Alma mater, Biola University, where he received a bachelor of science in business and data analytics.
To learn more about True, visit his personal website or view his author profiles on Amazon, Nasdaq and Forbes.


