The Klinger Oscillator is a technical analysis tool used to quantify the long-term money flow, while simultaneously considering the short-term fluctuations in an asset. It merges price, volume, and time into one coherent oscillator. This indicator is meant to lead the price movements, making it especially beneficial to traders. Its key components include Volume Force and Trend Confirmation, serving to merge price, volume, and time into a coherent oscillator, thereby providing early signals of potential price reversals. This unique blend of sensitivity and long-term insight makes the Klinger Oscillator a powerful tool for traders. Advantages include its ability to signal price reversals before they occur and to provide a comprehensive view of money flow. However, it may produce false signals during periods of sideways market activity, and its effectiveness is maximized when used in conjunction with other technical analysis tools and risk management techniques. The primary function and purpose of the Klinger Oscillator are to predict and identify long-term trends of money flow while staying sensitive to short-term fluctuations. As a trend-following indicator, it aims to signal potential price reversals ahead of time by highlighting divergences between volume and price. This dual functionality enables traders to capture significant trends while also providing an early alert system for possible trend changes. It's this combination of long-term trend identification and short-term sensitivity that makes the Klinger Oscillator a valuable tool for many traders. Volume Force is a key part of the Klinger Oscillator, combining price, volume, and time to create a measure of buying and selling pressure. The Klinger Oscillator uses two lines for trend confirmation: the Klinger Oscillator line and the signal line. When the Oscillator line crosses the signal line upwards, it may indicate a bullish trend. Conversely, a downward cross may suggest a bearish trend. Volume Force is calculated by first determining the high, low, and close prices for a given period. The differences between these are then multiplied by volume and a scaling factor to create the Volume Force. The Klinger Oscillator Line is calculated as the difference between a 34-period exponential moving average (EMA) of the Volume Force and a 55-period EMA of the Volume Force. The Signal Line is simply a 13-period EMA of the Klinger Oscillator line. The Klinger Oscillator is interpreted by looking for divergences between the indicator and the price. For instance, if the price is increasing but the Klinger Oscillator is decreasing, it could signal an upcoming price reversal. Divergences between the Klinger Oscillator and price trends can provide early warning signs of potential reversals in the market. Spotting these early could provide advantageous entry and exit points for trades. The Klinger Oscillator can be used in various trading strategies. Primarily, it can provide buy or sell signals when the Oscillator line crosses the signal line. Additionally, traders can use it as a tool for spotting potential price reversals by observing divergences between the oscillator and the price. A bullish signal is generated when the Klinger Oscillator line crosses above the signal line. Conversely, a bearish signal occurs when the Oscillator line crosses below the signal line. These crossings often precede a change in price direction, providing early entry points into potential market moves. The Klinger Oscillator can be combined with other technical analysis tools to enhance its effectiveness. For instance, integrating it with moving averages, relative strength index (RSI), or the Bollinger Bands can create a more robust trading system. Each of these indicators can provide additional context to the Klinger Oscillator's signals and help confirm potential trading opportunities. A practical example of using the Klinger Oscillator can be seen in a scenario where a trader is analyzing a specific stock. Suppose the stock has been in a strong upward trend, but the trader notices that the Klinger Oscillator is beginning to decline. This divergence between the price and the oscillator could indicate that the upward momentum is slowing and a price reversal may be imminent. The trader could then choose to exit their long position or even establish a short position in anticipation of the price falling. The primary advantage of the Klinger Oscillator is its sensitivity to short-term price changes while still providing a picture of the longer-term money flow. It can provide early signals of potential price reversals and can be an effective tool when used in conjunction with other indicators. Despite its strengths, the Klinger Oscillator also has its limitations. For one, it may produce false signals during periods of choppy or sideways markets. Additionally, like any technical analysis tool, it should not be used in isolation. A comprehensive trading strategy should include other analysis methods and risk management tools. The Money Flow Index (MFI) is another volume-based oscillator, but it primarily focuses on price changes and volume to measure buying and selling pressure. While the Klinger Oscillator aims to highlight longer-term trends in money flow, the MFI often provides a shorter-term perspective. On-Balance Volume (OBV) is a simple volume-based indicator that adds volume on up days and subtracts it on down days. While OBV can provide useful insights into the accumulation and distribution of an asset, the Klinger Oscillator offers a more nuanced picture of the money flow by considering price, volume, and time. Chaikin Money Flow (CMF) measures the amount of Money Flow Volume over a specific period. While both the CMF and the Klinger Oscillator consider volume and price, the Klinger Oscillator also incorporates time, potentially providing a more comprehensive view of the market. Like all technical indicators, it has its strengths and limitations, and it should be used in conjunction with other technical analysis tools and risk management techniques. The Klinger Oscillator is a nuanced technical analysis tool, combining price, volume, and time to provide a comprehensive view of the market's money flow. Understanding its components and calculations is crucial in interpreting its values and making informed trading decisions. Despite its inherent complexity, it provides significant advantages, such as its sensitivity to short-term price fluctuations while keeping sight of long-term trends. However, it's also important to acknowledge its limitations, including the potential for false signals in choppy markets. The Klinger Oscillator underscores the multifaceted nature of financial markets, embodying the need for a comprehensive approach in trading and financial analysis. In the hands of an informed trader, it can be a valuable addition to a well-rounded trading strategy.Definition of the Klinger Oscillator
Function and Purpose of the Klinger Oscillator
Understanding the Klinger Oscillator
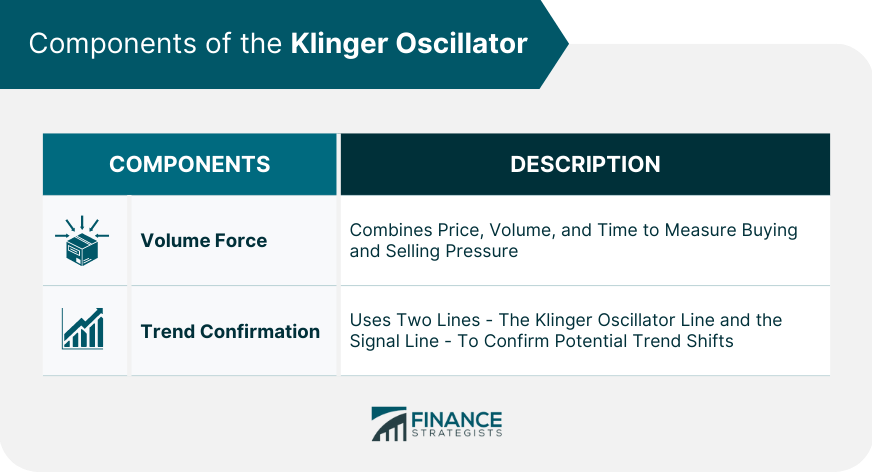
Components of the Klinger Oscillator

Volume Force
Trend Confirmation
Calculation of the Klinger Oscillator
Calculation of the Volume Force
Calculation of the Klinger Oscillator Line
Calculation of the Signal Line
Interpretation of Klinger Oscillator Values
Importance of Divergence in the Klinger Oscillator
The Klinger Oscillator in Trading
Application of the Klinger Oscillator in Trading Strategies
Bullish and Bearish Signals in the Klinger Oscillator
Integration of the Klinger Oscillator With Other Technical Indicators
Trading Examples Using the Klinger Oscillator
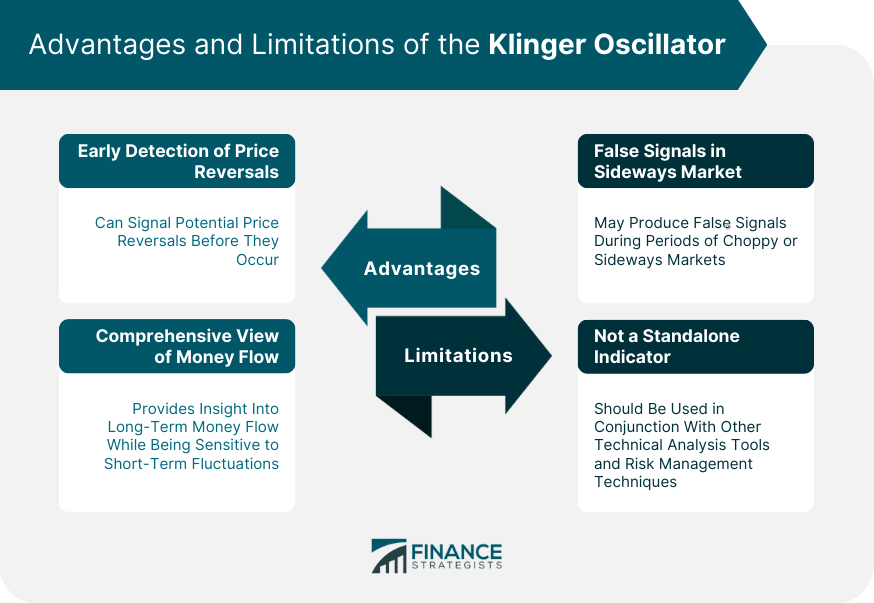
Advantages and Limitations of the Klinger Oscillator

Advantages of the Klinger Oscillator
Limitations and Risks of the Klinger Oscillator
Comparison of the Klinger Oscillator With Other Volume Oscillators
Klinger Oscillator vs Money Flow Index (MFI)
Klinger Oscillator vs On-Balance Volume (OBV)
Klinger Oscillator vs Chaikin Money Flow (CMF)
Conclusion
Klinger Oscillator FAQs
The Klinger Oscillator is a technical analysis tool that quantifies long-term money flow while accounting for short-term fluctuations. It combines price, volume, and time to create an oscillator that can signal potential price reversals.
The Klinger Oscillator is calculated using Volume Force, which combines price, volume, and time. This is then used to create the Klinger Oscillator line and a signal line, the crossover of which can suggest potential trend shifts.
Advantages of the Klinger Oscillator include its ability to detect potential price reversals and provide insights into long-term money flow. However, it may produce false signals during sideways market activity and should be used alongside other technical analysis tools.
Unlike other volume oscillators, the Klinger Oscillator incorporates price, volume, and time. While this provides a more comprehensive view of the market, it may make the Klinger Oscillator more complex to understand and use effectively.
Traders interested in identifying long-term trends of money flow while remaining sensitive to short-term price changes may find the Klinger Oscillator particularly useful. It can serve as a valuable tool for those looking to anticipate price reversals and understand more comprehensive views of money flow in the market.
True Tamplin is a published author, public speaker, CEO of UpDigital, and founder of Finance Strategists.
True is a Certified Educator in Personal Finance (CEPF®), author of The Handy Financial Ratios Guide, a member of the Society for Advancing Business Editing and Writing, contributes to his financial education site, Finance Strategists, and has spoken to various financial communities such as the CFA Institute, as well as university students like his Alma mater, Biola University, where he received a bachelor of science in business and data analytics.
To learn more about True, visit his personal website or view his author profiles on Amazon, Nasdaq and Forbes.


