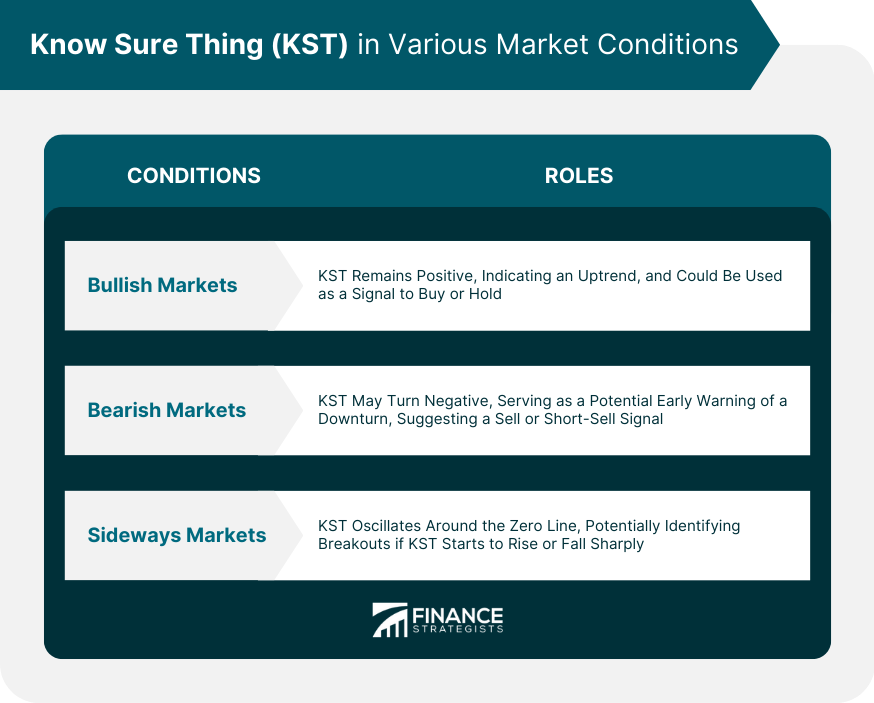
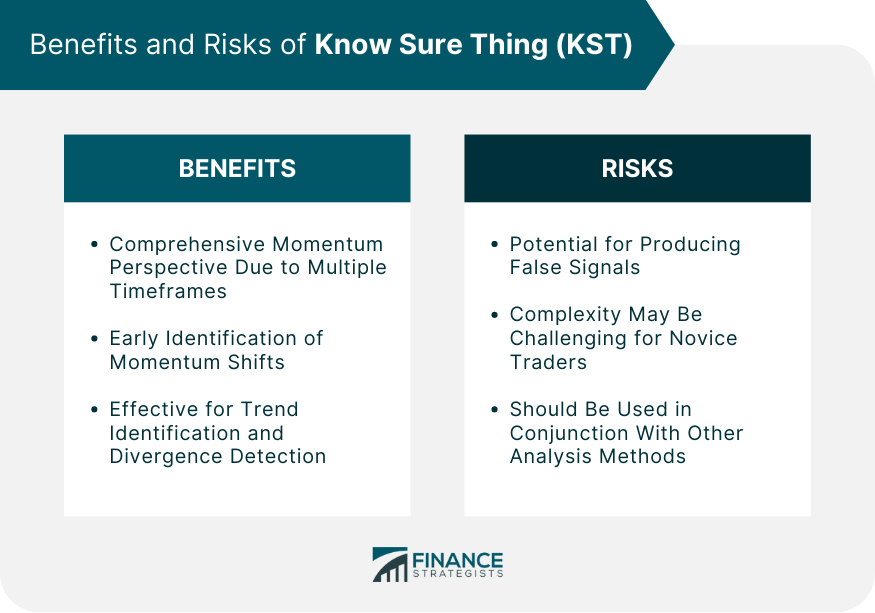
The Know Sure Thing (KST) is a momentum oscillator developed by Martin Pring, designed to predict price changes by evaluating the market's rate of change across four different timeframes. In trading, the KST is a versatile tool that aids in identifying market trends, pinpointing momentum shifts for effective entry and exit points, and detecting divergences that may indicate potential reversals. Its ability to operate across various timeframes provides a comprehensive momentum picture, rendering it a valuable addition to a trader's arsenal. However, the KST has its limitations, such as the potential for producing false signals, and its complexity may pose challenges for novice traders. Furthermore, like all technical indicators, the KST should be used in conjunction with other tools and analysis methods to enhance decision-making in trading. The KST consists of four different Rate of Change (ROC) indicators, each applied to a different timeframe. These ROCs are then smoothed with a Simple Moving Average (SMA) and combined to form the KST value. Calculating the KST involves several steps. First, ROC values are calculated for four different timeframes. These ROCs are then smoothed with an SMA. The resulting smoothed ROCs are multiplied by a weighting factor, which emphasizes the longer timeframes. The sum of these weighted ROCs forms the KST value. A positive KST value indicates bullish momentum, while a negative value suggests bearish momentum. Traders often look for "crossings" where the KST crosses the zero line, as these can signal potential buy or sell opportunities. The KST can be used to identify the underlying trend of an asset. When the KST is positive and rising, this suggests an uptrend. Conversely, a falling KST in negative territory can indicate a downtrend. Momentum traders can use the KST to identify potential entry and exit points. When the KST rises above the zero line, this could signal a buying opportunity. When it falls below the zero line, it could suggest a time to sell. Divergences between the KST and price can signal potential reversals. If the price makes a higher high but the KST makes a lower high, this bearish divergence could signal a forthcoming downtrend. Conversely, a bullish divergence where the price makes a lower low but the KST makes a higher low could indicate an impending uptrend. In bullish markets, the KST is likely to remain positive, often rising before the price does. Traders can use this as a signal to buy or hold their position. In bearish markets, the KST may fall into negative territory, potentially providing an early warning sign of a market downturn. This could be a signal for traders to sell or short-sell the asset. In sideways markets, the KST may oscillate around the zero line. Traders can use this to identify potential breakouts if the KST begins to rise or fall sharply. The KST offers several benefits, including its versatility and early signal generation. By incorporating multiple timeframes, it provides a more comprehensive view of market momentum than many other indicators. Additionally, by identifying shifts in momentum before price changes, it can provide early entry and exit signals. Despite its advantages, the KST is not without limitations. Like all technical indicators, it is not infallible and can produce false signals. Additionally, its complexity can make it challenging to use effectively, particularly for novice traders. While both the KST and MACD are momentum oscillators, they differ in their calculation and interpretation. The MACD is based on the relationship between two exponential moving averages, while the KST is derived from four ROC indicators. As such, the KST may be more sensitive to shifts in momentum than the MACD. The RSI is another momentum oscillator, but it focuses on price changes rather than ROC. The RSI can provide a more straightforward indication of overbought or oversold conditions, but it may not identify momentum shifts as early as the KST. The Stochastic Oscillator is also used to identify overbought and oversold conditions, based on an asset's closing price relative to its high-low range. While the Stochastic Oscillator can provide useful signals in trending markets, the KST's incorporation of multiple timeframes may make it more effective in volatile markets. For a practical example of the KST in action, consider a scenario where an asset's price is rising, but the KST begins to decline. This bearish divergence could be an early warning sign of a potential price reversal, prompting a trader to consider selling or reducing their position. A case study from the 2008 financial crisis highlights the KST's utility. In the lead-up to the crisis, the KST for the S&P 500 began to decline, even as the index continued to reach new highs. This bearish divergence was an early sign of the forthcoming market crash. As financial technology continues to evolve, traders may find new ways to utilize the KST. Machine learning algorithms could potentially be trained to better interpret KST signals, improving the accuracy and reliability of this indicator. The trend towards data-driven trading could lead to increased use of the KST, as traders seek out more comprehensive and sophisticated indicators. Additionally, developments in financial technology could enable real-time KST calculations across a wider range of assets and markets. The Know Sure Thing (KST) is a momentum oscillator developed by Martin Pring, designed to identify shifts in market momentum across multiple timeframes. The application of KST in trading spans various market conditions, assisting in trend identification, momentum trading, and divergence detection. It provides traders with crucial insights, thereby influencing their buying, selling, or holding decisions. However, like any technical indicator, KST comes with its advantages and limitations. Its multi-timeframe approach gives it an edge over many momentum indicators by offering a broader view of market momentum. This feature also enables the generation of early entry and exit signals, which are highly valuable to traders. Yet, it's worth noting that KST can be complex to interpret and occasionally produce false signals. Consequently, traders must exercise caution and ideally use KST in conjunction with other technical indicators to make informed decisions.Definition of Know Sure Thing (KST)
Understanding the Mechanics of Know Sure Thing (KST)
Components of KST
Calculation of KST
Interpretation of KST Values
Application of Know Sure Thing (KST) in Trading
KST in Trend Identification
KST in Momentum Trading
Use of KST in Divergence Detection
Know Sure Thing (KST) in Various Market Conditions

KST in Bullish Markets
KST in Bearish Markets
KST in Sideways Markets
Benefits and Risks of Know Sure Thing (KST)

Benefits of Using KST
Risks of Using KST
Comparison of Know Sure Thing (KST) With Other Technical Indicators
KST vs Moving Average Convergence Divergence (MACD)
KST vs Relative Strength Index (RSI)
KST vs Stochastic Oscillator
Practical Examples and Case Studies of Know Sure Thing (KST)
Real-World Trading Examples Using KST
Case Studies Highlighting Effective Use of KST
Future Trends and Developments in Know Sure Thing (KST)
Innovations and Technological Advancements Influencing KST
Predicted Future Developments and Applications of KST
Conclusion
Know Sure Thing (KST) FAQs
The Know Sure Thing (KST) is a momentum oscillator developed by Martin Pring. It's designed to predict price changes by evaluating the market's rate of change across four different timeframes.
In trading, KST can be utilized to identify market trends, detect divergences, and pinpoint momentum shifts, which can be used to determine effective entry and exit points.
The main advantages of using KST include its ability to provide a comprehensive view of market momentum due to its multiple timeframes, and its capability to identify momentum shifts early.
The KST can sometimes produce false signals, and its complexity may be challenging for novice traders. It's recommended to use KST in conjunction with other technical analysis methods to enhance decision-making.
Unlike indicators like the Moving Average Convergence Divergence (MACD) or the Relative Strength Index (RSI), which focus on moving averages and price changes, respectively, KST analyzes the rate of change across different timeframes. This gives KST a more sensitive and comprehensive view of market momentum.
True Tamplin is a published author, public speaker, CEO of UpDigital, and founder of Finance Strategists.
True is a Certified Educator in Personal Finance (CEPF®), author of The Handy Financial Ratios Guide, a member of the Society for Advancing Business Editing and Writing, contributes to his financial education site, Finance Strategists, and has spoken to various financial communities such as the CFA Institute, as well as university students like his Alma mater, Biola University, where he received a bachelor of science in business and data analytics.
To learn more about True, visit his personal website or view his author profiles on Amazon, Nasdaq and Forbes.


