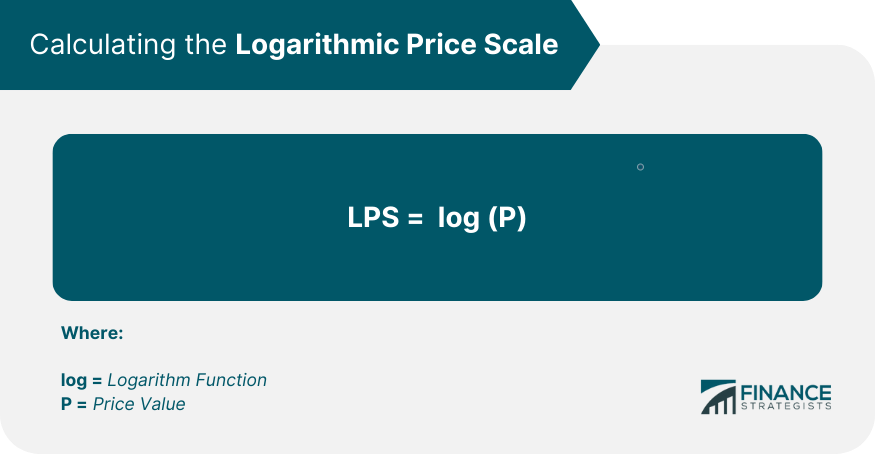
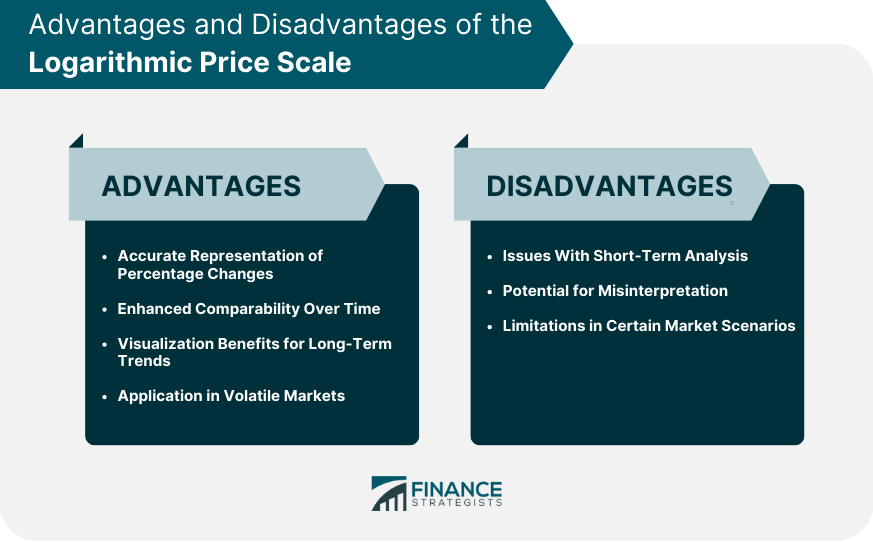
A logarithmic price scale—often known as a semi-log scale—is a type of scale used in financial charting. Unlike linear scales, which plot price changes in terms of absolute values, logarithmic scales plot price changes in terms of relative or percentage changes. Essentially, each unit on the vertical axis represents a constant percent change rather than a constant numerical change. Linear scales display equal values spaced evenly. For instance, on a chart with a linear scale, the distance from $1 to $2 would be the same as the distance from $10 to $11. A logarithmic scale, in contrast, displays proportional changes. The distance from $1 to $2 (a 100% change) would be the same as the distance from $10 to $20 (also a 100% change). Logarithmic price scales are predominantly used in long-term charting, where significant price movements may occur. They can help to compare the relative size of percentage changes and enable the identification of exponential growth trends. Logarithms are fundamental mathematical tools that find significant applications in the field of finance. Their unique properties enable us to analyze exponential growth, decay, and compounding returns more effectively, providing valuable insights into interest rates and price movements. In finance, logarithms are employed to create the logarithmic price scale, which offers various advantages in visualizing and understanding market data. To calculate the logarithmic price scale, a straightforward method is employed. It involves taking the logarithm of the price value. For example, if the price is $100, the corresponding log scale value would be calculated as log(100), where the logarithm can be computed using any appropriate base. Let's denote the price value as P and the logarithmic price scale as LPS. The formula for calculating the logarithmic price scale is as follows: In this formula, log represents the logarithm function, and P represents the price value. By applying the logarithm function to the price, we obtain the logarithmic price scale, which offers valuable insights into percentage changes and relative significance in finance. By utilizing the logarithmic price scale, investors and analysts can accurately represent percentage changes over time, enhance comparability for historical price analysis, visualize long-term trends, and effectively interpret market movements, particularly in volatile scenarios. However, it is important to be aware of the limitations of the logarithmic price scale. These limitations include the potential issues with short-term analysis, the potential for misinterpretation of data for those unfamiliar with the scale, and its limitations in certain market scenarios characterized by low volatility and gradual price changes. Consider a stock that grows from $10 to $20, then from $20 to $40. Both changes represent a 100% increase. On a linear scale, the $20 to $40 increase would appear twice as large as the $10 to $20 increase, despite the same percentage change. However, on a logarithmic scale, both changes would appear equally large because both represent a 100% change. The logarithmic price scale provides an accurate representation of percentage changes over time. It helps investors visualize how much a price has increased or decreased in relative terms, not merely in absolute dollar terms. This scale is particularly useful for charting historical prices or tracking the performance of investments over extended periods. It provides enhanced comparability over time, helping investors understand the relative significance of market movements. Logarithmic price scales emphasize percentage changes, which can be advantageous when analyzing long-term trends. It allows trends of varying lengths to be compared on a relative basis. The logarithmic price scale also helps in volatile markets where large price swings can distort the scale and make interpretation difficult. Logarithmic scales can make these large swings more manageable and easier to interpret. Logarithmic price scales may not be as beneficial for short-term price analysis because small price changes or fluctuations may not appear as dramatic as they would on a linear scale. This could lead to underestimating the significance of recent market movements. For those unfamiliar with the logarithmic scale's nature, there's a potential for misinterpretation of data. It's essential to understand that the distances on the scale represent percentage changes rather than absolute price differences. Logarithmic scales may not be suitable for all market scenarios. For example, they may need to clearly represent markets characterized by low volatility and gradual price changes. A linear price scale is the most common type of scale used in financial charting. It represents absolute changes in price, making it more intuitive and straightforward for most people to understand. Much like the logarithmic scale, a semi-log price scale uses a logarithmic scale for price changes and a linear scale for time periods. This hybrid scale can help visualize long-term price movements alongside short-term changes. The quadratic price scale is less common and plots price changes against the square of the price. This type of scale can sometimes be useful for visualizing data with an exponentially increasing variance. In stock market analysis, the logarithmic price scale is particularly useful when examining long-term trends. By emphasizing percentage changes rather than absolute price movements, investors and analysts can compare the relative growth of stocks over extended periods. This enables a better understanding of the performance and potential of individual stocks and the overall market trends. Forex trading, characterized by constant fluctuations in exchange rates, benefits from the logarithmic price scale. Even minor changes in currency values can have significant impacts on trading outcomes. By using the logarithmic scale, traders can better visualize and analyze these market movements, enabling them to identify patterns, trends, and potential opportunities more effectively.. Commodity markets, known for their volatility and price fluctuations, can also benefit from the logarithmic price scale. Commodities such as oil, gold, and agricultural products often experience significant price swings over time. The logarithmic scale allows investors and traders to accurately assess these changes in a more proportional manner, taking into account the percentage changes rather than focusing solely on the absolute price differences. This facilitates a more informed analysis of commodity price movements and aids in decision-making regarding buying, selling, or holding commodity positions. The logarithmic price scale is a powerful tool that offers unique benefits in financial analysis. It provides a more accurate representation of percentage changes, enhances comparability over time, and effectively visualizes long-term trends. While it may have certain limitations and potential for misinterpretation, its benefits make it an essential tool for financial professionals and investors, especially in volatile and long-term market scenarios. It is important to remember that the choice of scale—whether linear or logarithmic—should be dictated by the specific requirements of your analysis. Understanding how and when to use these scales can significantly improve your analysis and financial decision-making abilities. Lastly, as a call to action promoting wealth management, consider seeking professional advice or undertaking comprehensive financial education to understand these tools better. Knowledge of the logarithmic price scale and other financial scales can empower you to make informed decisions, ultimately contributing to your wealth management goals.What Is a Logarithmic Price Scale?
The Mathematics Behind the Logarithmic Price Scale
The Role of Logarithms in Finance
Calculation Method

Illustration With Examples
Benefits of Using the Logarithmic Price Scale in Finance
Accurate Representation of Percentage Changes
Enhanced Comparability Over Time
Visualization Benefits for Long-Term Trends
Application in Volatile Markets
Drawbacks and Limitations of the Logarithmic Price Scale
Issues With Short-Term Analysis
Potential for Misinterpretation
Limitations in Certain Market Scenarios

Comparison of the Logarithmic Price Scale With Other Financial Scales
Linear Price Scale
Semi-log Price Scale
Quadratic Price Scale
Application of the Logarithmic Price Scale in Various Financial Instruments
Use in Stock Market Analysis
Application in Forex Trading
Role in Commodity Price Analysis
Conclusion
Logarithmic Price Scale FAQs
A logarithmic price scale is a type of scale used in financial charting that represents price changes in terms of percentage changes rather than absolute numerical changes.
A logarithmic price scale represents proportional changes, whereas a linear scale shows absolute changes. For example, on a logarithmic scale, a price change from $10 to $20 would appear the same as a change from $20 to $40 because both represent a 100% increase.
Logarithmic price scales are typically beneficial for long-term price analysis, where substantial price changes may occur. They are also useful in volatile markets where large price swings can distort the scale on linear graphs.
Logarithmic price scales might not be suitable for short-term price analysis because small price changes might not appear as dramatic as on a linear scale. There's also the potential for misinterpretation if one is unfamiliar with the scale's nature.
Logarithmic price scales are widely used in various areas of financial analysis, including stock market analysis, forex trading, and commodity price analysis. They are particularly effective in representing long-term trends and relative growth.
True Tamplin is a published author, public speaker, CEO of UpDigital, and founder of Finance Strategists.
True is a Certified Educator in Personal Finance (CEPF®), author of The Handy Financial Ratios Guide, a member of the Society for Advancing Business Editing and Writing, contributes to his financial education site, Finance Strategists, and has spoken to various financial communities such as the CFA Institute, as well as university students like his Alma mater, Biola University, where he received a bachelor of science in business and data analytics.
To learn more about True, visit his personal website or view his author profiles on Amazon, Nasdaq and Forbes.


