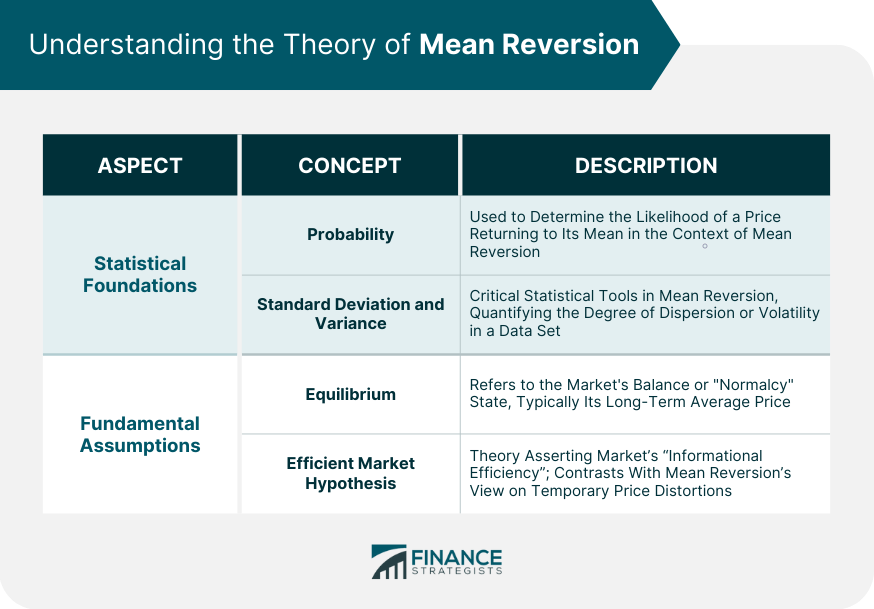
Mean reversion is a key financial concept that hypothesizes that asset prices and returns eventually return towards their long-term mean or average. In other words, it's the idea that extreme fluctuations in price—whether high or low—are likely to revert to their historical average over time. In the field of financial analysis, mean reversion plays a significant role in determining investment strategies, risk management, and portfolio diversification. It helps financial analysts predict price movements and develop investment strategies based on historical price patterns. While mean reversion can be a useful concept in investing and trading, it's worth noting that it's not foolproof. Markets can and do remain irrational for long periods, and prices can deviate from their mean for many reasons, such as changes in the underlying business, macroeconomic shifts, or changes in investor sentiment. The probability of an event occurring, particularly in financial markets, often dictates the actions of investors and traders. In the context of mean reversion, probability is used to determine the likelihood of a price returning to its mean. Standard deviation and variance are two critical statistical tools used in the theory of mean reversion. These measures help in quantifying the degree of dispersion or volatility in a data set—such as the price of a financial asset—and play a key role in calculating the potential for reversion to the mean. At the heart of the theory of mean reversion is the concept of equilibrium. It's the idea that markets, despite their frequent ups and downs, have a state of balance or "normalcy" to which they eventually return. This equilibrium state is typically represented by the long-term average price of a financial asset. The efficient market hypothesis (EMH) is a fundamental pillar of modern financial theory. It asserts that financial markets are "informationally efficient," meaning that asset prices always reflect all available information. However, the theory of mean reversion often stands in contrast to EMH, suggesting that markets can overreact or underreact to new information, creating temporary price distortions that eventually correct themselves. The Random Walk Theory posits that the prices of securities move randomly and that past movement cannot predict future movement. However, the mean reversion theory provides a contrasting viewpoint, stating that prices deviating significantly from their historical averages eventually revert back. This difference forms the core of the debate between the theories. One notable example of mean reversion can be observed in the aftermath of the dot-com bubble of the late 1990s. During this period, technology stocks saw inflated prices far from their long-term averages. However, in the early 2000s, these prices drastically fell and returned closer to their historical means. In the foreign exchange market, mean reversion can be used to analyze currency pairs. This analysis is based on the idea that exchange rates are likely to revert to their historical averages over time. Traders can use mean reversion strategies to take advantage of temporary price deviations. For instance, the EUR/USD pair has seen periods of substantial overvaluation and undervaluation over the past decade. However, these rates have often reverted to their long-term average, supporting the idea of mean reversion. Several factors can influence mean reversion in commodity prices, such as changes in supply and demand, geopolitical events, and market sentiment. For example, an unexpected increase in crude oil production might temporarily lower prices, but as the market adjusts to this new supply, prices may revert to their long-term average. The 2008 financial crisis serves as a prime example of mean reversion in commodity prices. Post-crisis, the prices of many commodities fell sharply but gradually recovered over the following years to levels more in line with their historical averages. In a pair trading strategy, two co-integrated securities are identified. When the spread between them widens, the underperforming security is bought, and the outperforming security is sold short, assuming that the spread will eventually revert to its mean. This strategy's success depends on accurately assessing the risk and potential reward of the selected securities. It is crucial to consider factors such as the securities' volatility, correlation, and response to market events. Risk arbitrage, also known as merger arbitrage, is a strategy that exploits the price discrepancies between the current market price of a stock and the price of the same stock post-merger. The mean reversion concept comes into play as the price discrepancy is expected to close, i.e., revert to the mean, once the merger is completed. Statistical arbitrage involves a portfolio of long and short positions in stocks in the expectation that the prices will revert to their historical or statistical norms. The selection of these stocks is generally carried out using complex algorithms and quantitative models. The Ornstein-Uhlenbeck process is a stochastic process used in quantitative finance to model mean reversion. It is used to describe the evolution of financial variables, such as interest rates or commodities prices, that tend to revert to a long-term mean value. The Generalized Autoregressive Conditional Heteroskedasticity (GARCH) model is used to estimate the volatility of returns. It assumes that the amount of randomness, or variance, in the returns changes over time but reverts back to a long-term average. Hence, it is suitable for modeling mean reversion. Applying mean reversion in asset allocation can influence diversification and rebalancing strategies. An investor might choose to rebalance a portfolio when asset prices stray too far from their long-term averages, under the assumption that they will eventually revert. Timing and market conditions also play crucial roles. For instance, an investor might identify assets that are trading below their historical averages during a market downturn, with the expectation that these assets will revert to their means when the market recovers. Mean reversion can be a helpful tool in understanding and managing volatility in a portfolio. If asset prices are expected to revert to the mean, periods of high volatility (i.e., large price deviations from the mean) may be viewed as temporary and not necessarily indicative of a longer-term trend. Investors can also use mean reversion to inform hedging strategies. For example, if a certain asset's price has deviated significantly from its mean, an investor might take a counter position in a correlated asset to hedge against the possibility of the first asset's price reverting to the mean. Mean reversion relies on the assumption that prices will revert to a long-term mean, but certain unpredictable events, known as Black Swan events, can drastically alter a market's equilibrium. These events can cause significant deviations from the mean that may not correct for a considerable time. While the EMH is a cornerstone of modern finance, it has been criticized for oversimplifying complex market dynamics. If markets were perfectly efficient and always accurately priced, there would be little room for mean reversion as prices would never deviate significantly from the mean. Market manipulation and insider trading can distort price movements and influence mean reversion. These practices can create artificial price deviations that may not revert to the mean as naturally or predictably as expected. Mean reversion is a fundamental concept in finance that suggests asset prices and returns tend to move towards their long-term mean or average over time. By understanding the foundations and assumptions of mean reversion, such as probability, standard deviation, variance, equilibrium, and the EMH, financial analysts can make informed predictions about price movements and develop strategies based on historical patterns. Mean reversion is observable in various financial markets, including stock markets, foreign exchange markets, and commodity markets. Traders can utilize mean reversion strategies to capitalize on temporary price deviations in currency pairs, identify co-integrated securities for pair trading, or exploit price discrepancies in risk arbitrage. Quantitative models like the Ornstein-Uhlenbeck process and the GARCH model are employed to model and estimate mean reversion in financial variables. However, it is important to acknowledge the limitations of mean reversion, such as the impact of market anomalies, Black Swan events, and market manipulation. Considering the above provides investors with a framework to navigate volatile markets and potentially capitalize on price movements that revert to the mean.What Is Mean Reversion?
Understanding the Theory of Mean Reversion
Statistical Foundations
Probability
Standard Deviation and Variance
Fundamental Assumptions
Equilibrium
Efficient Market Hypothesis

Mean Reversion in Financial Markets
Stock Prices
Random Walk Theory vs Mean Reversion
Case of Mean Reversion in Stock Markets
Foreign Exchange Rates
Currency Pair Analysis
Historical Trends
Commodity Prices
Factors Influencing Commodity Reversion
Impact of Global Events
Models and Strategies Using Mean Reversion
Pair Trading Strategy
Selection of Securities
Risk-And-Reward Assessment
Arbitrage Strategy
Risk Arbitrage
Statistical Arbitrage
Quantitative Models
Ornstein-Uhlenbeck Process
GARCH Model
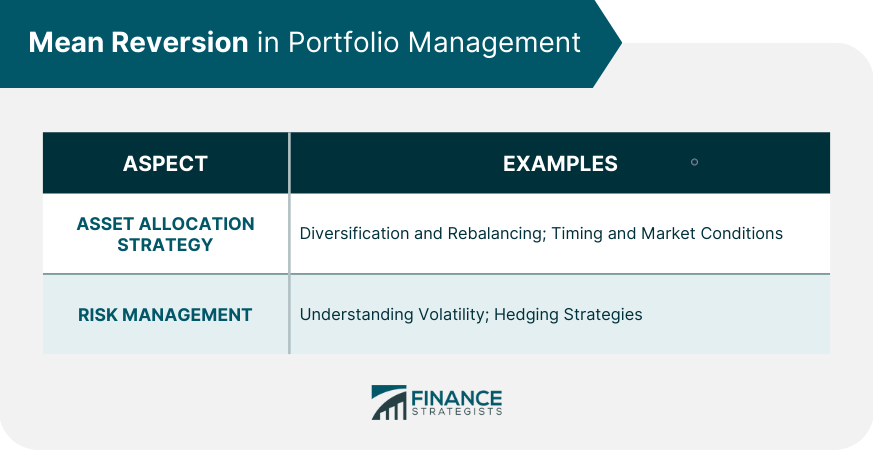
Mean Reversion in Portfolio Management
Asset Allocation Strategy
Diversification and Rebalancing
Timing and Market Conditions
Risk Management
Understanding Volatility
Hedging Strategies

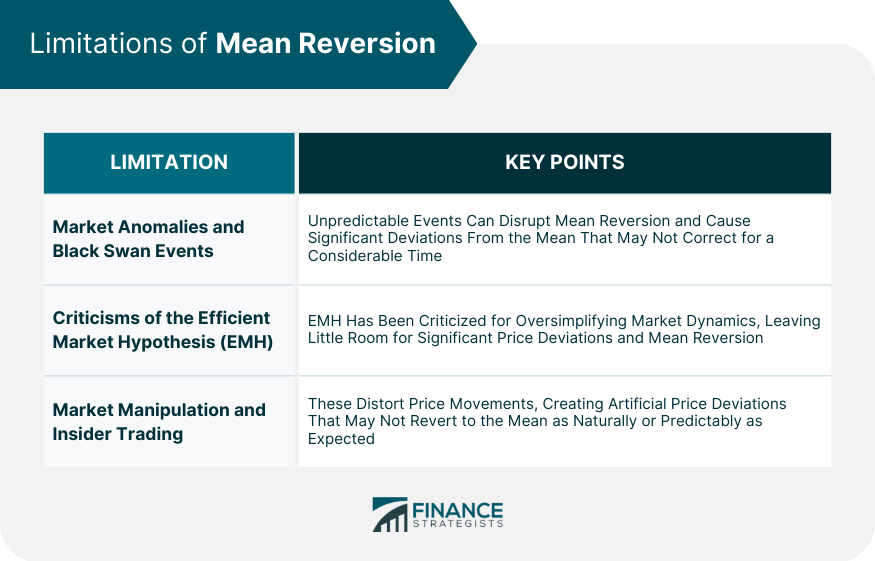
Limitations of Mean Reversion
Market Anomalies and Black Swan Events
Criticisms of the Efficient Market Hypothesis
Market Manipulation and Insider Trading

Final Thoughts
Mean Reversion FAQs
The purpose of mean reversion in finance is to understand and predict the tendency of asset prices and returns to move back towards their long-term mean or average. It helps financial analysts develop investment strategies, manage risk, and diversify portfolios based on historical price patterns.
Mean reversion and the efficient market hypothesis present contrasting views on market behavior. While EMH assumes that asset prices always reflect all available information and move randomly, mean reversion suggests that prices deviating significantly from their historical averages will eventually revert back to those averages. This indicates that markets can overreact or underreact to new information, creating temporary price distortions.
Yes, there are several examples of mean reversion in financial markets. One notable example is the dot-com bubble of the late 1990s, where technology stocks experienced inflated prices far from their long-term averages. However, in the early 2000s, these prices drastically fell and returned closer to their historical means. The 2008 financial crisis also serves as an example, with commodity prices falling sharply but gradually recovering over time.
Mean reversion can be applied in portfolio management through asset allocation, diversification, and risk management. Investors can rebalance their portfolios when asset prices deviate significantly from their long-term averages, assuming that prices will eventually revert. Additionally, mean reversion can inform strategies for managing volatility and hedging against price deviations.
Yes, there are limitations to mean reversion. Market anomalies and unforeseen events, known as Black Swan events, can disrupt the expected reversion to the mean. The efficient market hypothesis has also been criticized for oversimplifying market dynamics, which may affect the reliability of mean reversion. Furthermore, market manipulation and insider trading can distort price movements and impede the predictability of mean reversion. It is essential to consider these limitations when applying mean reversion in financial analysis and decision-making.
True Tamplin is a published author, public speaker, CEO of UpDigital, and founder of Finance Strategists.
True is a Certified Educator in Personal Finance (CEPF®), author of The Handy Financial Ratios Guide, a member of the Society for Advancing Business Editing and Writing, contributes to his financial education site, Finance Strategists, and has spoken to various financial communities such as the CFA Institute, as well as university students like his Alma mater, Biola University, where he received a bachelor of science in business and data analytics.
To learn more about True, visit his personal website or view his author profiles on Amazon, Nasdaq and Forbes.


