An oscillator is a mathematical tool used by traders to forecast future market movements. It generates a value that fluctuates above and below a centerline, usually indicating overbought (high value) or oversold (low value) conditions in a market. Oscillators are typically used in conjunction with other technical analysis tools to confirm signals and prevent false indications. Oscillators play a crucial role in technical analysis as they help traders identify potential turning points in price movements. They can signal whether a security is overbought, and thus potentially overvalued, or oversold, which might indicate undervaluation. This information can provide traders with insights into when to buy or sell a security. As such, oscillators are particularly useful in sideways or non-trending markets, where price levels fluctuate within a specific range. The terms overbought and oversold refer to market conditions where an asset's price has risen or fallen too far in the short term and is likely due for a price correction. When an oscillator's value is in the upper range, the asset is considered overbought. Conversely, if the oscillator's value is in the lower range, the asset is considered oversold. It's important to note that these conditions don't necessarily mean the price will immediately reverse. Prices can remain overbought or oversold for extended periods during strong upward or downward trends. Divergence and convergence are crucial concepts in oscillator analysis. Divergence occurs when the price of an asset and an oscillator move in opposite directions. For example, if the price makes a higher high, but the oscillator makes a lower high, it suggests bearish divergence and a possible trend reversal. Bullish divergence occurs when the price makes a lower low, but the oscillator makes a higher low. Convergence, on the other hand, happens when the price and oscillator move in the same direction, reinforcing the ongoing trend. This can serve as a strong signal to continue a current trading strategy. The Relative Strength Index is a momentum oscillator that measures the speed and change of price movements. It ranges from 0 to 100 and is typically used to identify overbought or oversold conditions. An RSI above 70 suggests an overbought condition, while an RSI below 30 indicates an oversold condition. The Stochastic Oscillator is another momentum indicator that compares a particular closing price of a security to a range of its prices over a certain period. The oscillator's value ranges from 0 to 100, with a reading above 80 usually considered overbought, and a reading below 20 considered oversold. MACD is a trend-following momentum oscillator. It calculates the difference between two Exponential Moving Averages (EMA) and compares it to a signal line. The MACD triggers technical signals when it crosses above (bullish) or below (bearish) its signal line. Additionally, the MACD histogram can provide insights into the strength of a price movement. The Commodity Channel Index is a versatile oscillator used to identify cyclical trends in commodities but can also be applied to other asset classes. The CCI compares the current price with an average price over a specific period and then measures the variation from the mean. It is often used to spot overbought and oversold conditions, divergences, and generate trade signals. Oscillators can help traders identify a variety of trading signals. These signals often involve crossing a specific threshold (like overbought or oversold levels) or detecting divergences between the oscillator and price. For instance, a trader might sell a security when its RSI crosses above 70, indicating overbought conditions, and buy when the RSI crosses below 30, indicating oversold conditions. The effectiveness of oscillators can vary under different market conditions. They tend to perform best in non-trending, choppy markets where prices oscillate within a defined range. In these conditions, oscillators can provide valuable signals for buying near the bottom of the range and selling near the top. In trending markets, oscillators can remain overbought or oversold for extended periods, leading to potential false signals. For this reason, traders often use oscillators alongside trend-following indicators in trending markets to confirm trading signals and reduce false alarms. Day trading involves buying and selling financial instruments within a single trading day. Oscillators can be instrumental for day traders, providing real-time insights into short-term market conditions. For example, RSI and stochastic oscillators can help identify intraday overbought or oversold conditions, suggesting potential entry and exit points. Swing traders aim to capture gains in a market within a span of a few days to weeks. Oscillators can help identify potential reversals, providing valuable entry and exit points. Divergences between price and oscillators can signal possible trend reversals, a valuable insight for swing traders. While oscillators are primarily used for short-term trading decisions, they can also inform longer-term investment strategies. For example, overbought or oversold conditions on a weekly or monthly timeframe might suggest potential long-term investment opportunities. Similarly, divergences on these timeframes can indicate significant shifts in market trends, informing strategic investment decisions. One limitation of oscillators is that they can produce false signals. For instance, in a strong uptrend, a security might become overbought and remain so for an extended period. Similarly, in a strong downtrend, a security might become oversold and stay in that condition for a while. Traders acting solely on these overbought or oversold signals might prematurely enter or exit trades, potentially leading to losses. Market volatility can also distort oscillator readings. During periods of high volatility, price swings can become more extreme, leading oscillators to generate signals that might not hold under less volatile conditions. It's crucial for traders to adjust their oscillator-based strategies based on prevailing market volatility. While oscillators provide valuable insights into market conditions, they don't take into account fundamental factors like economic indicators, company performance, or industry trends. These factors can significantly influence a security's price. As such, traders should ideally combine oscillator analysis with fundamental analysis for a comprehensive approach to market evaluation. Oscillators, like most technical indicators, aren't perfect at timing market entries and exits. They might provide signals that appear to be early or late, leading to missed opportunities or adverse trades. Traders should use oscillators as part of a broader trading strategy, not as standalone decision-making tools. Oscillators are valuable mathematical tools in technical analysis that assist traders in predicting future market movements. They help identify overbought and oversold conditions, potential turning points, and generate trading signals. Oscillators like the RSI, Stochastic Oscillator, MACD, and CCI provide insights into momentum, price divergence, and cyclical trends. They can be used in various trading strategies, from short to long-term. It's important to note that oscillators have limitations. False signals can occur in strong trending markets, and market volatility can impact their readings. Traders should consider market conditions and adjust their strategies accordingly. Oscillators should be used in conjunction with other technical analysis tools and fundamental analysis to gain a comprehensive understanding of the market. By understanding their principles, types, applications, and limitations, traders can effectively incorporate oscillators into their trading strategies and enhance their trading outcomes.What Is an Oscillator?
Basic Principles of Oscillators
Overbought and Oversold
Divergence and Convergence
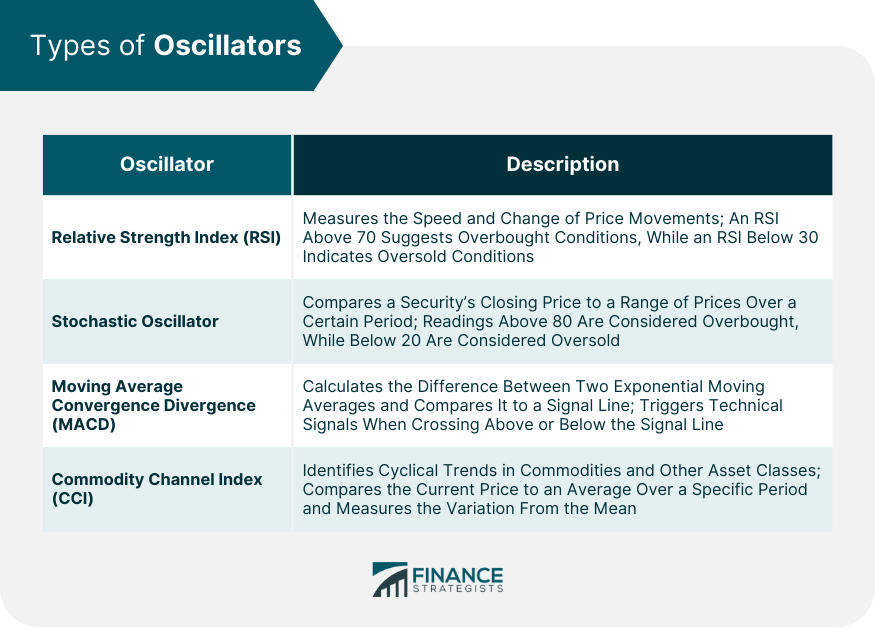
Types of Oscillators
Relative Strength Index (RSI)
Stochastic Oscillator
Moving Average Convergence Divergence (MACD)
Commodity Channel Index (CCI)

Uses of Oscillators
Identifying Trading Signals
Application in Different Market Conditions
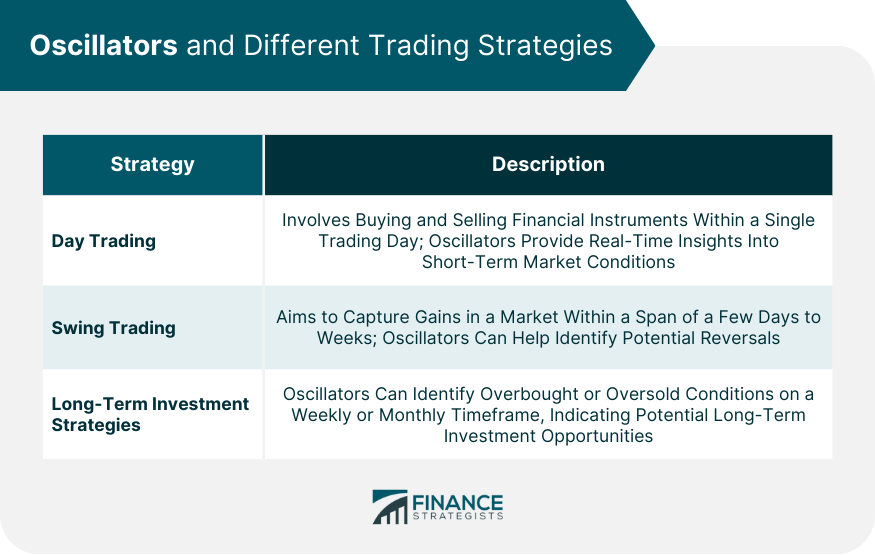
Oscillators and Different Trading Strategies
Day Trading
Swing Trading
Long-Term Investment Strategies

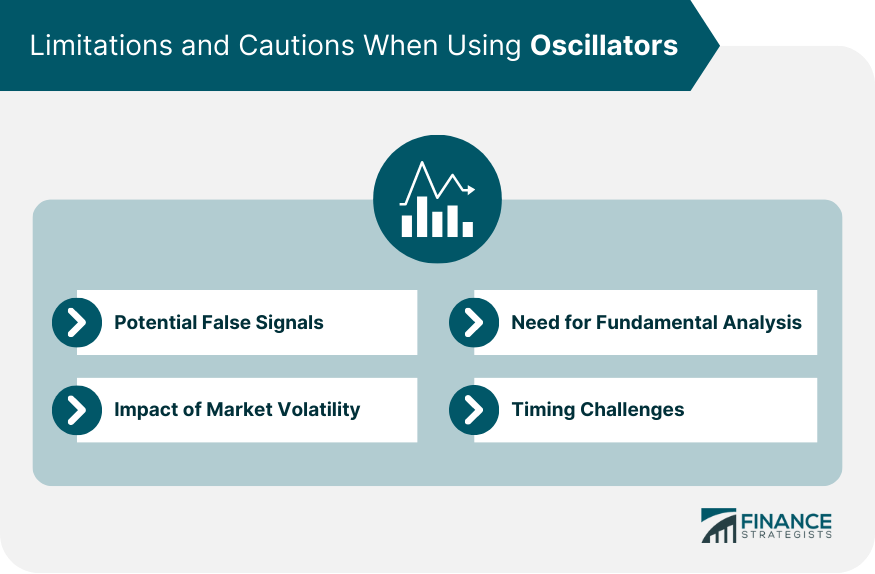
Limitations and Cautions When Using Oscillators
Potential False Signals
Impact of Market Volatility
Need for Fundamental Analysis
Timing Challenges

Final Thoughts
Oscillator FAQs
An oscillator is a mathematical tool used in technical analysis to forecast future market movements. It generates a value that fluctuates above and below a centerline, indicating overbought or oversold conditions in a market.
Oscillators help traders identify potential turning points in price movements and provide insights into market conditions. They can signal when a security is overbought (potentially overvalued) or oversold (potentially undervalued), aiding traders in deciding when to buy or sell a security.
Oscillators can be valuable in generating trading signals, but they are not infallible. Traders should use oscillators in conjunction with other technical analysis tools and consider market conditions to avoid relying solely on oscillator signals.
While oscillators are primarily used for short-term trading decisions, they can also inform longer-term investment strategies. Overbought or oversold conditions on larger timeframes may indicate potential long-term investment opportunities.
Oscillators have limitations, including the potential for false signals in strong trending markets, the impact of market volatility on readings, and the need to consider fundamental analysis alongside technical analysis. Traders should be aware of these limitations and use oscillators as part of a broader trading strategy.
True Tamplin is a published author, public speaker, CEO of UpDigital, and founder of Finance Strategists.
True is a Certified Educator in Personal Finance (CEPF®), author of The Handy Financial Ratios Guide, a member of the Society for Advancing Business Editing and Writing, contributes to his financial education site, Finance Strategists, and has spoken to various financial communities such as the CFA Institute, as well as university students like his Alma mater, Biola University, where he received a bachelor of science in business and data analytics.
To learn more about True, visit his personal website or view his author profiles on Amazon, Nasdaq and Forbes.


