An Outside Reversal, often referred to as a key reversal, is a chart pattern used in technical analysis of financial markets. It represents a price pattern that reflects a situation where a security's high and low prices for the day exceed those achieved in the prior day's trading session. It serves as a powerful tool that helps traders identify potential inflection points in the market, signaling the possibility of an impending shift in the price direction. Outside Reversal plays a pivotal role in assisting traders to make informed decisions by providing insights into possible future price movements. Recognizing an Outside Reversal can enable traders to seize profitable trading opportunities, manage risk, and potentially exit positions that could lead to substantial losses. To fully understand Outside Reversal, it's essential to familiarize oneself with its components - Previous Day's High and Low, Opening Price, and Closing Price. These are the maximum and minimum prices at which a security, commodity, or currency was traded the previous day. To constitute an Outside Reversal, the high of the current day must exceed the previous day's high, and the low of the current day must be lower than the previous day's low. This indicates a larger trading range and is a sign of increased volatility. The opening price is the initial price at which the security is traded when the market opens. For a bearish Outside Reversal, the opening price should be higher than the previous day's high. In the case of a bullish Outside Reversal, the opening price should be lower than the previous day's low. This initial movement in the opposite direction of the existing trend signifies a potential change in market sentiment. The closing price is the final price at which the security is traded before the market closes for the day. For a bearish Outside Reversal, the closing price should be lower than the previous day's low, indicating that the sellers have taken control. Conversely, for a bullish Outside Reversal, the closing price should be higher than the previous day's high, suggesting that the buyers have gained the upper hand. Candlestick charts are fundamental in illustrating Outside Reversal patterns. The body of the candlestick represents the range between the opening and closing prices, while the shadows (or wicks) show the high and low prices for the period. A bullish Outside Reversal would be characterized by a candlestick that opens lower than the previous day's close and closes higher than the previous day's high. Conversely, a bearish Outside Reversal opens higher and closes lower than the previous day's range. For an Outside Reversal to be valid, there must be a preceding trend. This could be either an upward or downward trend. The Outside Reversal pattern then signifies a potential reversal of this trend. Increased trading volume during an Outside Reversal day is another essential condition to consider. A high volume indicates strong investor interest and adds credibility to the reversal signal, showing a significant change in market sentiment. Extreme price changes during the day of an Outside Reversal can provide additional confirmation for the pattern. These price fluctuations represent a struggle between buyers and sellers, and the eventual closing price indicates which group has gained control, signaling the future price direction. A Bullish Outside Reversal occurs when the market is in a downtrend. On the reversal day, the security opens lower, creating a new low, but then reverses direction to close above the high of the previous day. This pattern signals that buyers have overcome sellers, potentially leading to an upward price movement. Contrarily, a Bearish Outside Reversal happens during an uptrend. The security opens at a new high but then closes below the previous day's low. This suggests that sellers have taken control, and the price might start to decline. An Inside Day is another common chart pattern, but it is fundamentally different from an Outside Reversal. An Inside Day occurs when the current day's price range is entirely within the previous day's range, a pattern signaling market indecision. On the other hand, an Outside Reversal signifies a potential change in market direction as it breaks the prior day's price range. While similar, there is a crucial difference between Outside Reversals and Engulfing patterns. An Engulfing pattern refers to a situation where the body of the current candlestick engulfs the body of the previous one, but not necessarily its shadows. Meanwhile, an Outside Reversal is more comprehensive, with the current day's price range exceeding the previous day's entire range, including its shadows. This pattern typically emerges at the end of an uptrend or downtrend and can signal that the market sentiment is shifting. By identifying these turning points, traders can position themselves to take advantage of the potential new trend at its inception. For instance, a Bullish Outside Reversal indicates that buying pressure has taken over and may lead to rising prices. Conversely, a Bearish Outside Reversal suggests that selling pressure is dominant, which might cause prices to fall. By recognizing a potential reversal, traders can make proactive decisions, such as setting stop-loss orders or closing positions, to protect themselves from potential adverse market moves. This proactive approach can be crucial in preserving capital and ensuring long-term trading success. Outside Reversals can be integrated into broader trading strategies to enhance their effectiveness. For instance, traders can use Outside Reversals in combination with other technical indicators, like trend lines or moving averages, to confirm potential reversals. This can increase the probability of successful trades and improve overall trading performance. At times, the price may seem to form an Outside Reversal, but it doesn't lead to a sustained change in direction. As such, traders might prematurely enter or exit trades based on these signals, leading to potential losses. Outside Reversals, while powerful, shouldn't be used in isolation. It's essential to use them alongside other technical indicators to confirm their signals. For example, traders might look for increased trading volume on the day of the reversal or use trend lines, moving averages, or momentum indicators for added confirmation. Outside Reversals can signal a potential change in trend, but they don't provide information about how long this reversal might last or how significant the price change might be. Traders, therefore, need to use additional analysis or indicators to assess these factors. Outside Reversals, like many chart patterns, can be somewhat subjective. Different traders may interpret the same pattern differently, leading to varied trading decisions. It requires experience and a nuanced understanding of market dynamics to interpret and act on Outside Reversals effectively. Since Outside Reversals can occur relatively frequently, there's a risk that traders might over-trade based on these signals. Over-trading can lead to increased transaction costs and potential losses if every signal isn't carefully vetted and validated. One of the key practices when trading with Outside Reversal is to use additional technical indicators for confirmation. This can increase the reliability of the signal. For example, indicators such as trend lines, moving averages, or momentum oscillators like the Relative Strength Index (RSI), can help confirm the reversal signal. It's crucial to consider the broader market trend when trading with Outside Reversals. While these patterns can signal a potential reversal, they're more likely to be reliable when they align with the overall market trend. Trading volume can provide valuable context for an Outside Reversal. A spike in volume on the day of the reversal can indicate strong investor interest and lend credibility to the reversal signal. You can set stop-loss orders at appropriate levels to limit potential losses if the trade goes against you. Alternatively, you can use position sizing to manage your risk by limiting the size of your trade relative to your overall portfolio. Not every Outside Reversal will lead to a substantial price change, and rushing into a trade can potentially lead to losses. Wait for a confirmation from other indicators and ensure that the reversal aligns with the broader market trend before making your move. Take time to study past charts and identify instances of Outside Reversals. Practice your strategy in a demo account before transitioning to live trading. In the realm of technical analysis, the Outside Reversal is a potent tool in discerning potential market reversals. This pattern, reflecting a day of trading that breaks beyond the prior day's price range, can help traders seize profitable trading opportunities and manage risks effectively. Outside Reversals provide insights into possible future price movements and can be integrated into broader trading strategies to enhance their effectiveness. They offer benefits such as identifying potential trend reversals, predicting market sentiment, and improving risk management. However, it is important to note the limitations and risks associated with Outside Reversals, including the potential for false signals, the need for confirmation from other indicators, and the subjective nature of interpretation. By following best practices, such as confirming with additional indicators, considering the overall market, monitoring volume, using stop-loss orders or position sizing, being patient, and gaining experience through practice, traders can maximize the utility of Outside Reversals.What Is an Outside Reversal?
Components of an Outside Reversal
Definition of Key Elements
Previous Day's High and Low
Opening Price
Closing Price
Candlestick Charts in Relation to Outside Reversals
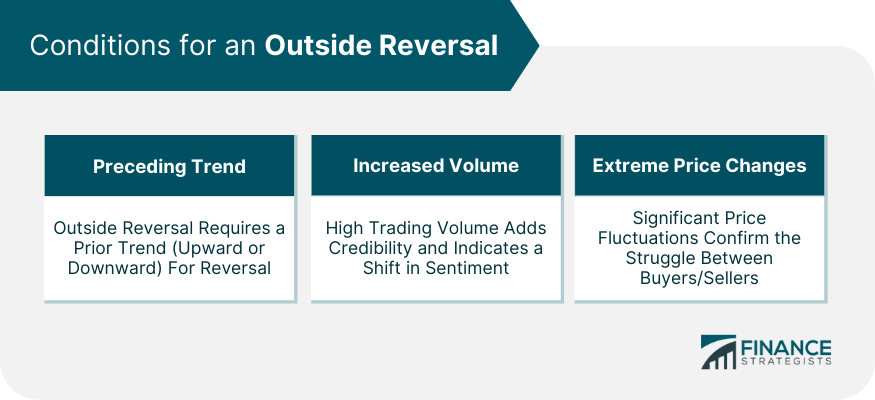
Conditions for an Outside Reversal
Preceding Trend
Increased Volume
Extreme Price Changes

Types of Outside Reversals
Bullish Outside Reversal
Bearish Outside Reversal
Distinguishing Outside Reversals From Other Patterns
Outside Reversal vs Inside Day
Comparison With Engulfing Patterns
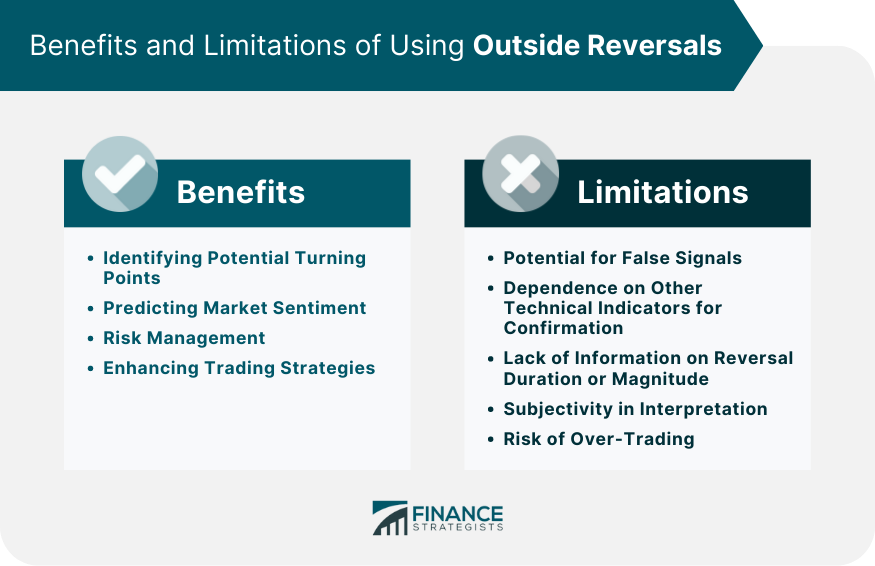
Benefits of Using Outside Reversals
Identifying Potential Turning Points
Predicting Market Sentiment
Risk Management
Enhancing Trading Strategies
Limitations and Risks of Using Outside Reversals
Potential for False Signals
Dependence on Other Technical Indicators for Confirmation
Lack of Information on Reversal Duration or Magnitude
Subjectivity in Interpretation
Risk of Over-Trading

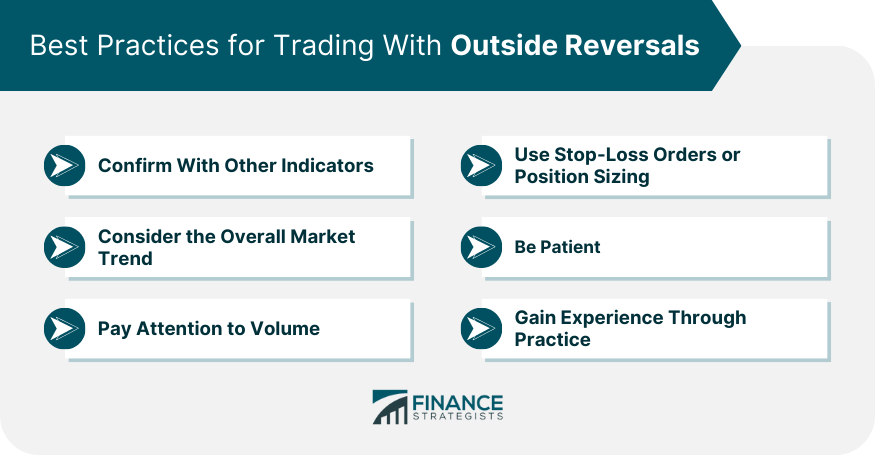
Best Practices for Trading With Outside Reversals
Confirm With Other Indicators
Consider the Overall Market Trend
Pay Attention to Volume
Use Stop-Loss Orders or Position Sizing
Be Patient
Gain Experience Through Practice

Final Thoughts
Outside Reversal FAQs
To identify an Outside Reversal pattern, look for a day where the high and low prices exceed those of the previous day. The opening price should be in the opposite direction of the prior trend, and the closing price should confirm the reversal by closing beyond the previous day's range.
Increased trading volume during an Outside Reversal indicates strong investor interest and adds credibility to the reversal signal. It suggests a significant change in market sentiment and increases the likelihood of a sustained trend reversal.
Outside Reversals indicate a potential change in trend, but they do not provide specific information about the duration or magnitude of the reversal. Additional analysis or indicators are needed to assess these factors.
To minimize the risk of false signals, it is recommended to use Outside Reversals in conjunction with other technical indicators for confirmation. Look for supporting factors such as increased volume, alignment with the overall market trend, and confirmation from trend lines or moving averages.
Outside Reversal patterns can occur relatively frequently, but it is important to exercise caution and avoid over-trading. Each signal should be carefully vetted and validated, considering factors such as confirmation from other indicators and alignment with the broader market trend.
True Tamplin is a published author, public speaker, CEO of UpDigital, and founder of Finance Strategists.
True is a Certified Educator in Personal Finance (CEPF®), author of The Handy Financial Ratios Guide, a member of the Society for Advancing Business Editing and Writing, contributes to his financial education site, Finance Strategists, and has spoken to various financial communities such as the CFA Institute, as well as university students like his Alma mater, Biola University, where he received a bachelor of science in business and data analytics.
To learn more about True, visit his personal website or view his author profiles on Amazon, Nasdaq and Forbes.


