Peer group analysis is a financial assessment method used by investors and analysts to compare a company's financial performance, valuation, and other key metrics against those of a group of similar companies. This comparative analysis helps identify the strengths and weaknesses of a company and evaluate its relative attractiveness as an investment opportunity. Peer group analysis plays a vital role in investment decision-making by providing investors with a benchmark for evaluating a company's financial position, operational efficiency, and growth potential. By comparing a company's performance with its peers, investors can gain valuable insights into its competitive position within the industry and identify potential opportunities or risks. Peer group analysis is commonly used for various purposes, including stock selection, portfolio construction, relative valuation, performance benchmarking, and credit analysis in fixed-income investing. To conduct effective peer group analysis, investors must first identify a group of comparable companies based on several criteria, such as: Companies operating in the same industry or sector typically face similar market dynamics, competitive pressures, and regulatory environments, making them suitable for comparison. Companies with similar market capitalizations are more likely to have comparable financial resources, operational scale, and risk profiles. Firms operating in similar geographical regions may be subject to similar economic conditions, market trends, and regulatory frameworks. Companies with similar business models and strategies may share common growth drivers, cost structures, and competitive advantages. Selecting an appropriate peer group can be challenging due to differences in business models, product offerings, or market dynamics. In such cases, investors may need to adjust for these differences to ensure meaningful comparisons. Benchmark indices, such as industry or sector-specific indices, can serve as useful proxies for peer groups by representing the average performance of a group of companies with similar characteristics. Investors typically compare a company's financial performance against its peers using various metrics, including: Higher revenue and earnings growth rates may indicate a company's ability to gain market share, expand its operations, or improve profitability. Comparing gross, operating, and net profit margins can help investors assess a company's cost structure, operational efficiency, and pricing power relative to its peers. Return on Equity (ROE) and Return on Assets (ROA) are measures of a company's profitability and efficiency in using its equity and assets, respectively. Higher values may indicate better financial performance compared to peers. Valuation ratios are commonly used to compare a company's market value against its earnings, sales, or book value relative to its peers. Examples of valuation ratios include: The Price-to-Earnings (P/E) ratio compares a company's stock price to its earnings per share, indicating how much investors are willing to pay for each dollar of earnings. A lower P/E ratio relative to peers may suggest a more attractively valued investment opportunity. The Price-to-Sales (P/S) ratio compares a company's stock price to its sales per share, providing insights into its valuation relative to its revenue. A lower P/S ratio may indicate a more attractive valuation compared to peers. The Price-to-Book (P/B) ratio compares a company's stock price to its book value per share, reflecting its valuation relative to its net asset value. A lower P/B ratio may suggest that a company is undervalued compared to its peers. Dividend yield is the annual dividend per share divided by the stock price, representing the income return on an investment. Comparing dividend yields among peers can help investors identify companies that offer attractive income potential. Operational efficiency metrics can provide insights into a company's ability to generate revenue or manage costs compared to its peers: Asset turnover measures the efficiency of a company's use of its assets to generate revenue. A higher asset turnover ratio may indicate better operational efficiency compared to peers. Inventory turnover measures the number of times a company sells and replaces its inventory during a specific period. Higher inventory turnover ratios may indicate more efficient inventory management and stronger demand for a company's products. Operating margin is the ratio of operating income to revenue, reflecting a company's profitability from its core business operations. A higher operating margin may suggest better cost management and pricing power relative to peers. Debt and solvency ratios can help investors assess a company's financial leverage and ability to meet its debt obligations compared to its peers: The debt-to-equity ratio measures a company's financial leverage by comparing its total debt to its shareholders' equity. A lower debt-to-equity ratio may indicate a stronger balance sheet and lower financial risk compared to peers. The interest coverage ratio measures a company's ability to meet its interest payments on outstanding debt. Higher interest coverage ratios may suggest better debt serviceability and lower default risk compared to peers. The current ratio and quick ratio measure a company's short-term liquidity by comparing its current assets to its current liabilities. Higher ratios may indicate better liquidity and solvency compared to peers. To conduct peer group analysis, investors must collect and compare financial data for the target company and its peers, such as financial statements, stock prices, and market data. This can be obtained from public sources like company websites, financial databases, and stock exchanges. By analyzing the key metrics and ratios discussed earlier, investors can evaluate a company's relative performance within its peer group and identify areas of strength, weakness, opportunity, or threat. A Strengths, Weaknesses, Opportunities, and Threats (SWOT) analysis can help investors identify factors contributing to a company's competitive position within its peer group and develop insights into its investment attractiveness. When comparing companies with different business models or operating in different market conditions, investors may need to adjust their analysis for these differences to ensure meaningful comparisons. Peer group analysis can help investors identify attractive investment opportunities by comparing a company's financial performance, valuation, and risk profile against its peers. By comparing a company's valuation ratios with those of its peers, investors can derive a relative valuation and estimate a target stock price for potential investment decisions. Peer group analysis can help investors uncover potential investment opportunities or risks by highlighting companies that outperform or underperform their peers. Investors can use peer group analysis to benchmark their investment performance against industry or sector averages and identify the factors driving their portfolio's relative performance. In fixed-income investing, peer group analysis can be used to compare the creditworthiness, yield spreads, and debt structures of different bond issuers. Investors can assess their relative creditworthiness and default risk by comparing credit ratings, financial ratios, and other credit metrics among bond issuers. Investors can use peer group analysis to compare the yield spreads and duration of bonds issued by comparable companies to identify attractive fixed-income investment opportunities or potential risks. Comparing the debt structures and covenants of different bond issuers can help investors understand the terms and conditions of their debt securities and assess the relative risks and potential returns. Peer group analysis can sometimes lead to misleading comparisons if the selected peers are not truly comparable or if the analysis does not account for differences in business models, market conditions, or other factors. The relevance of a peer group can change over time due to shifts in business strategy, market conditions, or other external factors, which may affect the validity of peer group comparisons. The selection of peers and interpretation of financial data in peer group analysis can be subjective, which may lead to different conclusions or investment recommendations. Peer group analysis is a valuable tool for investors to evaluate a company's relative performance, valuation, and risk profile by comparing it with a group of similar companies. This can help investors make more informed investment decisions and identify potential opportunities or risks. While peer group analysis can provide valuable insights, investors must combine it with other analytical techniques, such as fundamental, technical, and macroeconomic analyses, to comprehensively understand a company's investment attractiveness. Investors should stay updated on market developments and evolving peer group dynamics to ensure that their peer group analysis remains relevant and informative. This can help them adapt their investment strategies and continue to make informed investment decisions.Definition and Overview of Peer Group Analysis
Identifying Relevant Peer Groups
Criteria for Selecting Peer Companies
Industry and Sector Classification
Market Capitalization
Geographical Presence
Business Model and Strategy
Challenges in Identifying Comparable Peers
The Role of Benchmark Indices in Peer Group Analysis
Key Metrics and Ratios in Peer Group Analysis
Financial Performance Metrics
Revenue and Earnings Growth
Profit Margins
Return on Equity (ROE) and Return on Assets (ROA)
Valuation Ratios
Price-to-Earnings (P/E) Ratio
Price-to-Sales (P/S) Ratio
Price-to-Book (P/B) Ratio
Dividend Yield
Operational Efficiency Metrics
Asset Turnover
Inventory Turnover
Operating Margin
Debt and Solvency Ratios
Debt-to-Equity Ratio
Interest Coverage Ratio
Current Ratio and Quick Ratio
Conducting Peer Group Analysis
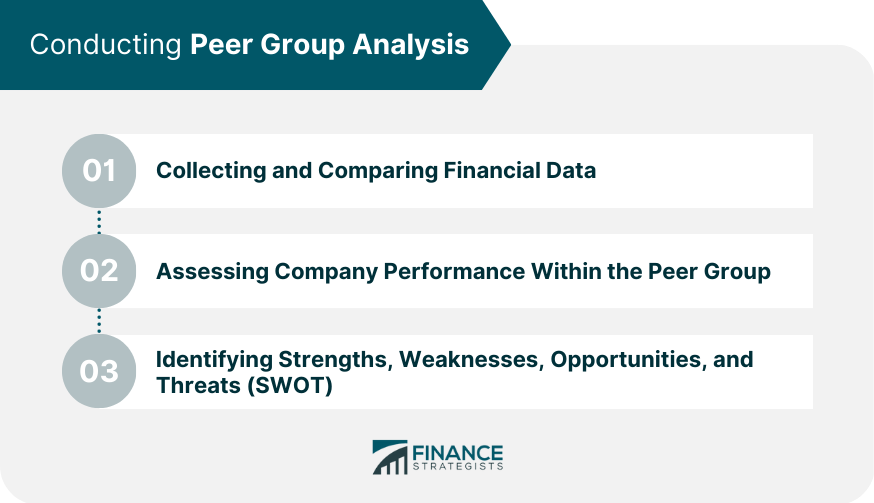
Collecting and Comparing Financial Data
Assessing Company Performance Within the Peer Group
Identifying Strengths, Weaknesses, Opportunities, and Threats (SWOT)

Applications of Peer Group Analysis in Investing
Stock Selection and Portfolio Construction
Relative Valuation and Target Price Estimation
Identifying Potential Investment Opportunities and Risks
Performance Benchmarking and Attribution Analysis
Peer Group Analysis in Fixed Income Investing
Identifying Comparable Issuers
Assessing Creditworthiness and Default Risk
Comparing Yield Spreads and Duration
Analyzing Debt Structure and Covenants
Limitations of Peer Group Analysis
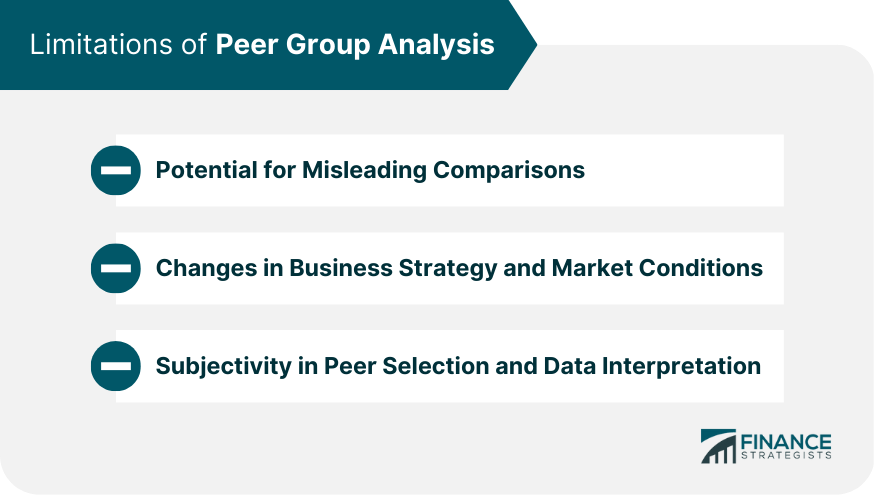
Potential for Misleading Comparisons
Changes in Business Strategy and Market Conditions
Subjectivity in Peer Selection and Data Interpretation

Conclusion
Peer Group Analysis FAQs
Peer group analysis is a type of financial analysis that compares a company's performance to a group of similar companies, known as the "peer group."
Peer group analysis is important because it provides a benchmark for a company's financial performance, enabling investors and analysts to evaluate its strengths and weaknesses better.
Peer group analysis is conducted by selecting a group of companies that are similar in size, industry, and other relevant characteristics. Financial metrics are then compared across the peer group to identify areas where a company may be outperforming or underperforming.
The limitations of peer group analysis include the potential for selection bias in choosing the peer group, as well as differences in accounting practices and other factors that can affect the comparability of financial metrics.
Examples of financial metrics used in peer group analysis include earnings per share, revenue growth, profit margins, return on equity, and debt-to-equity ratios.
True Tamplin is a published author, public speaker, CEO of UpDigital, and founder of Finance Strategists.
True is a Certified Educator in Personal Finance (CEPF®), author of The Handy Financial Ratios Guide, a member of the Society for Advancing Business Editing and Writing, contributes to his financial education site, Finance Strategists, and has spoken to various financial communities such as the CFA Institute, as well as university students like his Alma mater, Biola University, where he received a bachelor of science in business and data analytics.
To learn more about True, visit his personal website or view his author profiles on Amazon, Nasdaq and Forbes.


