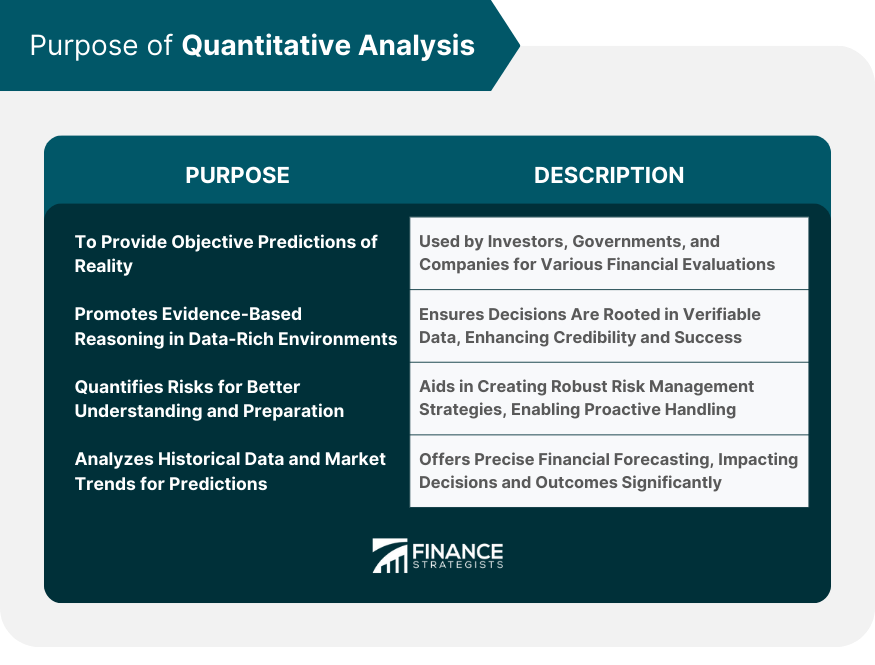
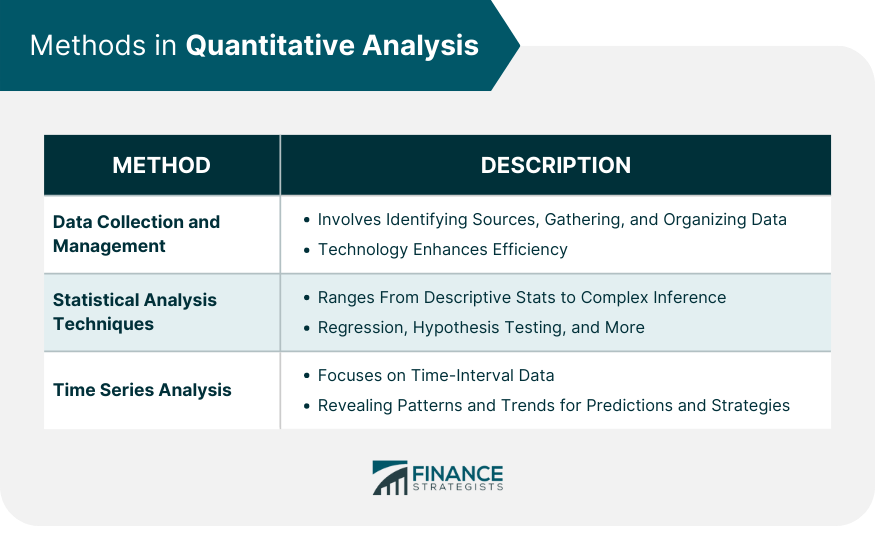
Quantitative Analysis is a technique by which an analyst relies on mathematical and statistical calculations, figures, and models to garner specific data. Quantitative analysts aim to use mathematics to represent a given reality or predict an outcome. By converting real-world scenarios into numerical data, QA seeks to provide objective verifiability and minimize the vagueness of qualitative interpretations. At its core, QA aims to transform complex scenarios into quantifiable metrics, providing clarity and paving the way for rational decision-making processes. The purpose of quantitative analysis is to provide an objective prediction of reality. Quantitative metrics are used by all kinds of financial entities for a variety of purposes; by investors to estimate the benefit or risk of an investment, by governments to model economic policies, and by companies to evaluate the performance of their products, just to name a few. In today's data-rich environment, relying on instinct or unverified information can be both risky and inefficient. QA stands as a beacon of evidence-based reasoning, promoting data-driven decisions. By providing a clear numeric representation of situations, QA ensures that decisions, whether in business, research, or policy-making, are rooted in verifiable data. This not only enhances the credibility of decisions but also increases the chances of achieving desired outcomes. Risk is an inherent part of many ventures, be it financial investments, business projects, or policy initiatives. QA offers tools to quantify these risks, allowing entities to understand potential pitfalls and rewards better. By assigning numeric values to various risk factors and assessing their potential impact, QA aids in creating robust risk management strategies. This ensures that entities are not just reacting to risks but are proactively prepared to handle them. Financial forecasting stands as one of the most prominent applications of QA. By analyzing historical data and market trends, QA provides insights into potential future financial scenarios. Whether it's predicting stock market movements, assessing the viability of an investment, or estimating future sales for a business, QA offers a structured method to gaze into the financial future. The precision it brings to forecasting can mean the difference between profit and loss in the intricate world of finance. Before any analysis can commence, data needs to be collected and managed effectively. This involves identifying relevant data sources, gathering information, and organizing it in a manner conducive to analysis. Modern QA often leverages technology, with databases and software tools playing a crucial role in storing and retrieving data. Proper data management ensures the integrity of the analysis, as the results are only as good as the data on which they are based. Statistical techniques form the backbone of QA. They provide the tools to extract meaningful insights from raw data. Techniques can range from simple descriptive statistics, which provide a basic understanding of data trends, to complex inferential methods, which allow analysts to draw conclusions about larger populations from sample data. Common tools include regression analysis, hypothesis testing, and probability distributions. Mastering these techniques is crucial for anyone aiming to dive deep into QA. Time series analysis focuses on data points collected or recorded at specific time intervals. This method is especially pertinent in financial markets, economic forecasts, and anywhere where data evolves over time. It allows analysts to identify patterns, trends, and cyclic behaviors in data. By understanding these temporal dynamics, predictions can be made about future data points, and strategies can be devised to capitalize on these predictions. Whether it's predicting stock prices or understanding seasonal sales trends, time series analysis stands as a powerful tool in the QA arsenal. In the world of finances, many common metrics rely on quantitative analysis. Some examples of quantitative metrics are: For example, say that Company A manufactures luxury watches. If they wish to improve their profit margins, they may wish to source cheaper materials; instead of gold and silver faces, for example, they may want to switch to brass and aluminum. While this would decrease the cost of manufacturing, it won't necessarily achieve Company A's goal. Customers that expect watches of the utmost quality may not wish to buy from Company A anymore if they feel that they have "cheapened" their products. Therefore Company A must use both quantitative and qualitative analysis to determine the optimal strategy for manufacturing and pricing to achieve their desired. In environments rife with subjectivity, biases, and emotions, QA provides a resolute anchor to neutrality. Decisions based on numbers and statistics inherently minimize human biases, ensuring that choices are not swayed by personal feelings or unverified beliefs. In fields like finance, healthcare, and research, this objective stance fosters a more accurate and fair evaluation process, crucial for impactful outcomes. Quantitative analysis thrives on this front. By employing a systematic approach, it deciphers patterns, trends, and relationships within the data. These insights, otherwise camouflaged in the vastness of raw data, empower entities, from businesses to policymakers, with actionable knowledge. Essentially, QA translates the abstractness of vast datasets into discernible knowledge, driving strategies and initiatives. Ambiguity is often a hindrance in decision-making processes. Quantitative analysis, with its numeric foundations, eradicates such ambiguities. The results it yields are both precise and quantifiable. For instance, instead of vaguely stating that sales have increased, QA would pinpoint that sales have surged by 15.2% in the last quarter. This precision allows for more informed decisions, better tracking of outcomes, and a clearer understanding of scenarios. It transforms vague approximations into exact metrics, a boon in most professional fields. Real-world scenarios can be incredibly complex. To make them analyzable, certain assumptions are made, potentially oversimplifying the situation. For example, in predicting stock market movements, factors like political stability or sudden global events might not always be accounted for. These oversights can sometimes lead to inaccurate or misleading results. Inaccurate, outdated, or incomplete data can skew results, leading to misguided conclusions. Moreover, in certain sectors or regions, the necessary data might not even be available or might be challenging to access. The phrase "garbage in, garbage out" aptly encapsulates this limitation: if the input data is flawed, the analysis and subsequent results will inherently carry those flaws. Many quantitative analysis techniques are rooted in historical data, operating on the premise that past patterns will persist in the future. While this often holds true, it's not an absolute. Relying too heavily on historical data can sometimes blindside analysts to novel events or shifts in patterns. For instance, unprecedented events like global pandemics or technological disruptions can drastically alter historical trends, rendering some QA predictions ineffective. Quantitative analysis is often used in conjunction with qualitative analysis, which focuses on ascribing meaning to the numbers used in quantitative analysis. Things like customer perception and company reputation are examples of qualitative variables. Quantitative Analysis (QA) embodies a systematic approach reliant on mathematical and statistical tools to transform complex scenarios into quantifiable metrics. Its purpose is to offer objective predictions of reality, utilized across various financial domains, from investment assessments to economic policies. In today's data-driven landscape, QA promotes evidence-based reasoning, aiding informed decision-making by providing clear numeric representations of situations. It excels in risk assessment, enabling entities to quantify potential pitfalls and rewards, thus fostering proactive risk management. Moreover, QA plays a pivotal role in financial forecasting, utilizing historical data and market trends for insightful predictions. Although QA offers precision, it comes with limitations such as assumptions and data quality concerns. Its interplay with qualitative analysis further enriches its applications, empowering well-rounded decision-making in the dynamic world of finance.Quantitative Analysis (QA) Definition
The Purpose of Quantitative Analysis
Data-Driven Decision Making
Risk Assessment and Management
Financial Forecasting
Methods in Quantitative Analysis
Data Collection and Management
Statistical Analysis Techniques
Time Series Analysis
Common Metrics Used in Quantitative Analysis
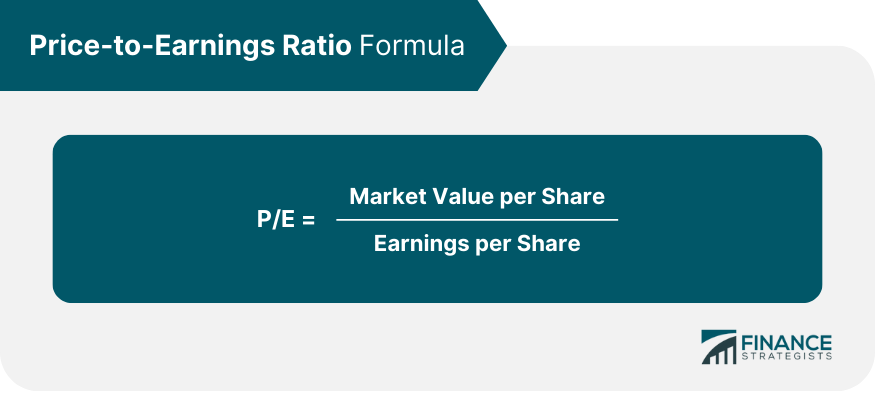
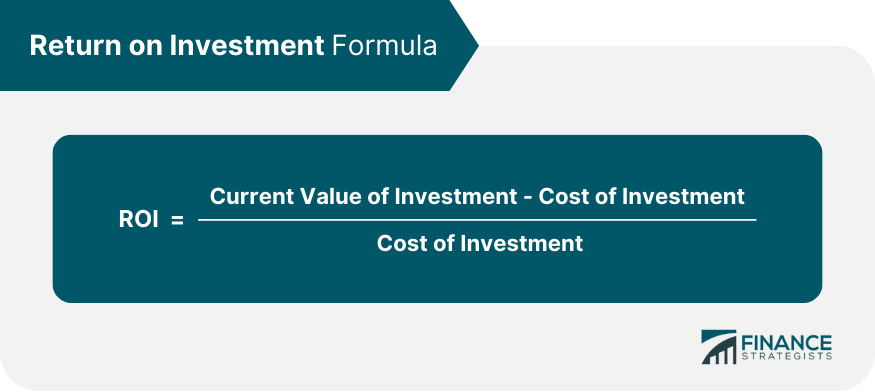
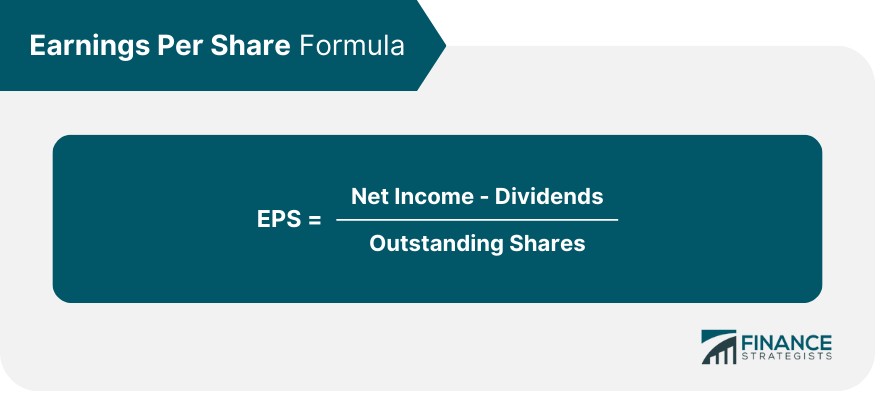
Examples of Quantitative Analysis
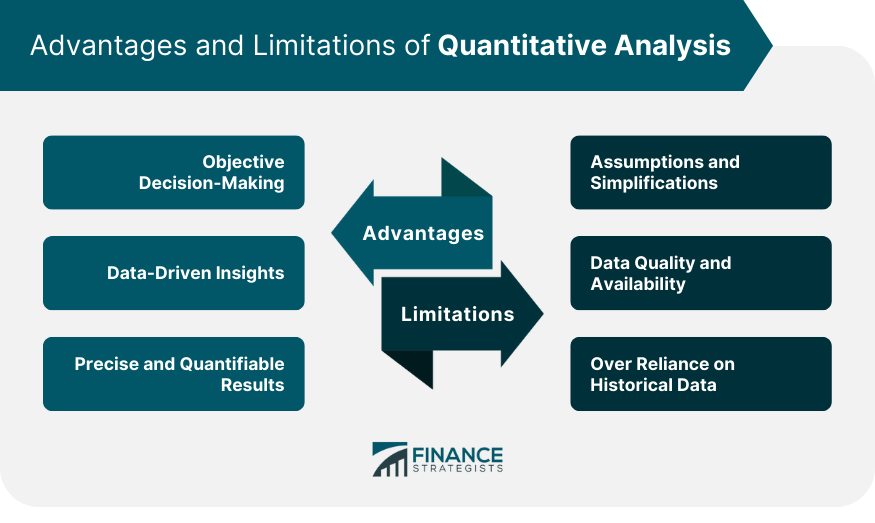
Advantages of Using Quantitative Analysis
Objective Decision-Making
Data-Driven Insights
Precise and Quantifiable Results
Limitations of Quantitative Analysis
Assumptions and Simplifications
Data Quality and Availability
Over Reliance on Historical Data
Quantitative vs Qualitative
Conclusion
Quantitative Analysis (QA) FAQs
QA stands for Quantitative Analysis in finance.
Quantitative Analysis is a technique by which an analyst relies on mathematical and statistical calculations, figures, and models to garner specific data.
Quantitative analysis is often used in conjunction with qualitative analysis, which focuses on ascribing meaning to the numbers used in quantitative analysis.
Some examples of quantitative metrics are: P/E Ratio, ROI, EPS
The purpose of quantitative analysis is to provide an objective prediction of reality.
True Tamplin is a published author, public speaker, CEO of UpDigital, and founder of Finance Strategists.
True is a Certified Educator in Personal Finance (CEPF®), author of The Handy Financial Ratios Guide, a member of the Society for Advancing Business Editing and Writing, contributes to his financial education site, Finance Strategists, and has spoken to various financial communities such as the CFA Institute, as well as university students like his Alma mater, Biola University, where he received a bachelor of science in business and data analytics.
To learn more about True, visit his personal website or view his author profiles on Amazon, Nasdaq and Forbes.


