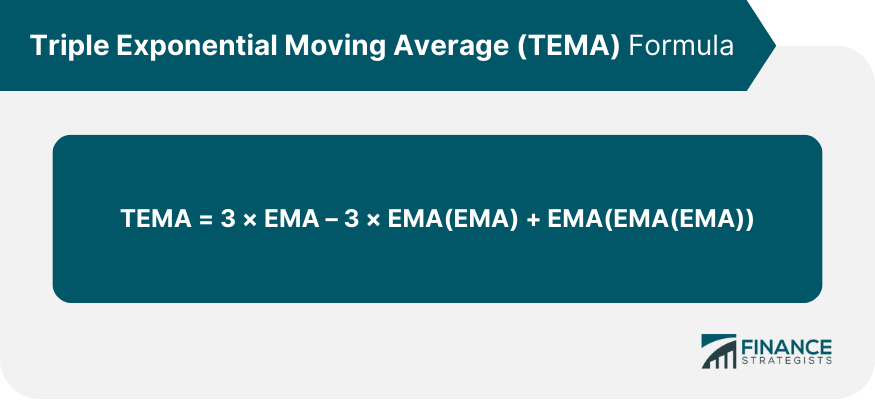
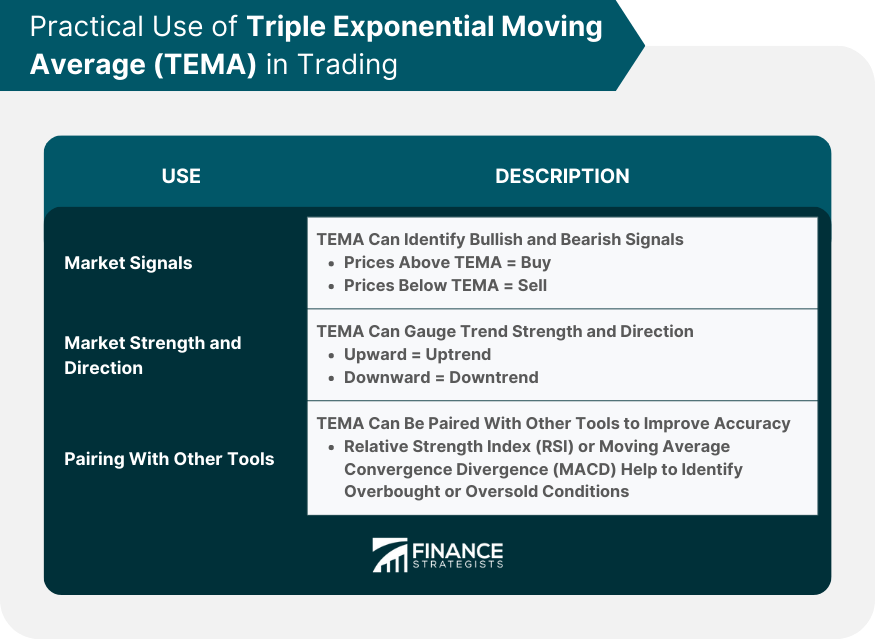
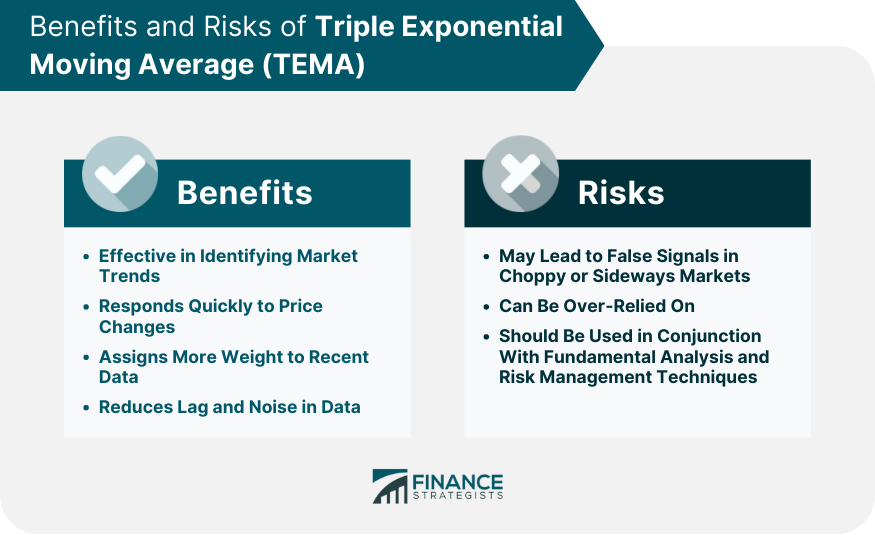
The Triple Exponential Moving Average (TEMA) is a technical indicator that improves the relevance and accuracy of trend data by eliminating noise and volatility. Designed by Patrick Mulloy, it applies exponential smoothing thrice to provide precise and responsive trend analysis. TEMA is used in financial markets to provide early signals of market shifts, enhancing investors' decision-making. By understanding TEMA, one gains an improved comprehension of market dynamics and trend strength, leading to better investment strategies. In the context of financial analysis, TEMA is an essential tool that assists in predicting future price movements, minimizing the risk of losses, and capitalizing on potential gains. The complex calculation of TEMA, although resource-intensive, is highly valued for its accuracy and relevance in diverse market conditions. The formula for TEMA involves a series of steps and the use of three Exponential Moving Averages (EMA). Here, EMA represents the exponential moving average, and EMA(EMA) and EMA(EMA(EMA)) represent the double and triple exponential moving averages, respectively. Each component in the formula plays a unique role. The first EMA allows for initial trend detection, the second (EMA of EMA) further smooths the data, and the third (EMA of EMA of EMA) suppresses noise to enhance trend clarity. The process of deriving TEMA requires executing a set of sequential mathematical operations: 1. First, the EMA for a given period is determined. Given the mathematical complexity involved, most traders use trading software or platforms, such as MetaTrader, TradingView, or Bloomberg Terminal, which have built-in TEMA indicators. The TEMA line serves as a valuable tool in distinguishing bullish and bearish market signals. When prices break above the TEMA line, traders often perceive this as an opportune moment to purchase or 'buy.' On the other hand, prices dipping below the TEMA line is generally viewed as a trigger to sell, reflective of bearish market sentiment. Beyond serving as a signal, TEMA provides an insightful gauge of market strength and the trajectory of trends. An upward-moving TEMA line suggests a powerful uptrend, indicative of growing market strength. Conversely, a downward TEMA trajectory points towards a robust downtrend, illustrating a weakening market. To fortify the precision of trading signals, TEMA is frequently paired with other technical tools. Instruments such as the Relative Strength Index, Moving Average Convergence Divergence (MACD), or volume indicators are often employed in conjunction with TEMA. This multi-faceted approach bolsters the accuracy of trading predictions and supports more informed decision-making. TEMA stands out for its effectiveness in identifying market trends. It responds quickly to price changes, allowing traders to spot trends and reversals earlier than with many other indicators. Unlike the SMA, which assigns equal weight to all values, TEMA assigns more weight to recent data, making it more responsive. Compared to the DEMA, TEMA is more sophisticated and can provide more accurate signals, though it may be more complex to understand. One of TEMA's major benefits is its ability to reduce lag and noise, making it easier for traders to spot genuine trends and ignore misleading price fluctuations. Even though the Triple Exponential Moving Average offers considerable advantages to traders, it's vital to note that this sophisticated tool has drawbacks. Firstly, TEMA is not impervious to the production of false signals, particularly in specific market conditions. In the face of choppy or sideways markets, price fluctuations can become erratic and inconsistent, leading to potential confusion in trend analysis. These fluctuations may cause the TEMA line to frequently cross with the price, resulting in a series of erroneous buy or sell signals, also known as the whipsaw effect. Traders must exercise caution during such periods, as incorrect interpretation of these signals could lead to misguided trading decisions and potential financial loss. Secondly, there exists the danger of overreliance on TEMA. Traders might fall into the trap of treating TEMA as a standalone infallible indicator, but this could prove to be a risky strategy. Relying exclusively on TEMA may overlook the broader market dynamics, leading to potential pitfalls. While TEMA is a potent instrument in the technical analyst's toolbox, it doesn't replace the need for a multi-dimensional approach to trading decisions. To counterbalance these risks, it is essential to combine TEMA with fundamental analysis. Fundamental analysis examines macroeconomic data, industry trends, and company-specific factors. Combining these two types of analysis helps provide a more rounded view of market conditions. The Triple Exponential Moving Average (TEMA) is a valuable technical indicator, enhancing the precision of trend data by reducing noise and volatility. With its complex calculations, TEMA offers valuable market signals, providing insight into market strength, direction, and trend identification. However, while TEMA can enhance trading strategies, it is not without limitations. It can produce false signals in certain market conditions and may lead to overreliance, potentially neglecting broader market dynamics. Therefore, it's essential to pair TEMA with other technical tools and fundamental analysis for a comprehensive trading strategy. TEMA serves as a significant asset in the trader's toolbox when used correctly, offering an avenue to minimize risks and maximize potential gains, paving the way for more informed and effective investment decisions.Triple Exponential Moving Average (TEMA) Overview
Mechanics of TEMA
Mathematics Behind TEMA
Explanation of the Formula

Component Exponential Moving Averages
How TEMA Is Computed
Step-By-Step Computation Process
2. Next, the EMA of the initial EMA, found in the previous step, is computed.
3. The subsequent step involves the evaluation of the EMA, determined in the second step.
4. Lastly, the values obtained from these computations are integrated into the TEMA formula to derive the final TEMA value.
Use of Software and Tools for Computation
Practical Use of TEMA in Trading
Leveraging TEMA for Market Signals
Ascertain Market Strength and Direction
Pairing TEMA With Other Technical Instruments

Benefits of TEMA
TEMA's Effectiveness in Identifying Market Trends
Benefits of Using TEMA Over Simple Moving Averages (SMA) or Double Exponential Moving Averages (DEMA)
Role of TEMA in Reducing Lag and Noise in Data
Limitations and Risks of Using TEMA
Instances When TEMA Might Lead to False Signals
Understanding the Risk of Overreliance on TEMA
Importance of Combining TEMA With Fundamental Analysis and Risk Management Techniques

Bottom Line
Triple Exponential Moving Average (TEMA) FAQs
The Triple Exponential Moving Average (TEMA) is a technical indicator used to smooth price data and identify market trends. It applies exponential weighting to the average, which reduces lag and noise in the data, providing a clearer and quicker picture of price movements.
TEMA is computed using a formula that involves three exponential moving averages (EMA). The process involves the calculation of an initial EMA, an EMA of the EMA, and an EMA of the EMA of the EMA. These values are then used in the TEMA formula. Most traders utilize trading software with built-in TEMA indicators due to the complexity of the computation.
TEMA helps traders to accurately identify market trends by reducing lag and noise in price data. It's particularly useful in short-term trading, where a quick response to price changes is crucial. Compared to simpler moving averages, TEMA is more responsive and can provide more accurate signals.
While TEMA is a powerful tool, it can occasionally produce false signals, particularly in choppy or sideways markets. Additionally, overreliance on TEMA without considering other indicators or fundamental analysis can lead to poor trading decisions.
TEMA should be used in conjunction with other technical indicators and fundamental analysis to increase the accuracy of trading signals. Additionally, it's crucial to integrate robust risk management techniques to protect against market volatility. Despite its limitations, TEMA remains a valuable tool for experienced traders due to its ability to identify trends swiftly and accurately.
True Tamplin is a published author, public speaker, CEO of UpDigital, and founder of Finance Strategists.
True is a Certified Educator in Personal Finance (CEPF®), author of The Handy Financial Ratios Guide, a member of the Society for Advancing Business Editing and Writing, contributes to his financial education site, Finance Strategists, and has spoken to various financial communities such as the CFA Institute, as well as university students like his Alma mater, Biola University, where he received a bachelor of science in business and data analytics.
To learn more about True, visit his personal website or view his author profiles on Amazon, Nasdaq and Forbes.


