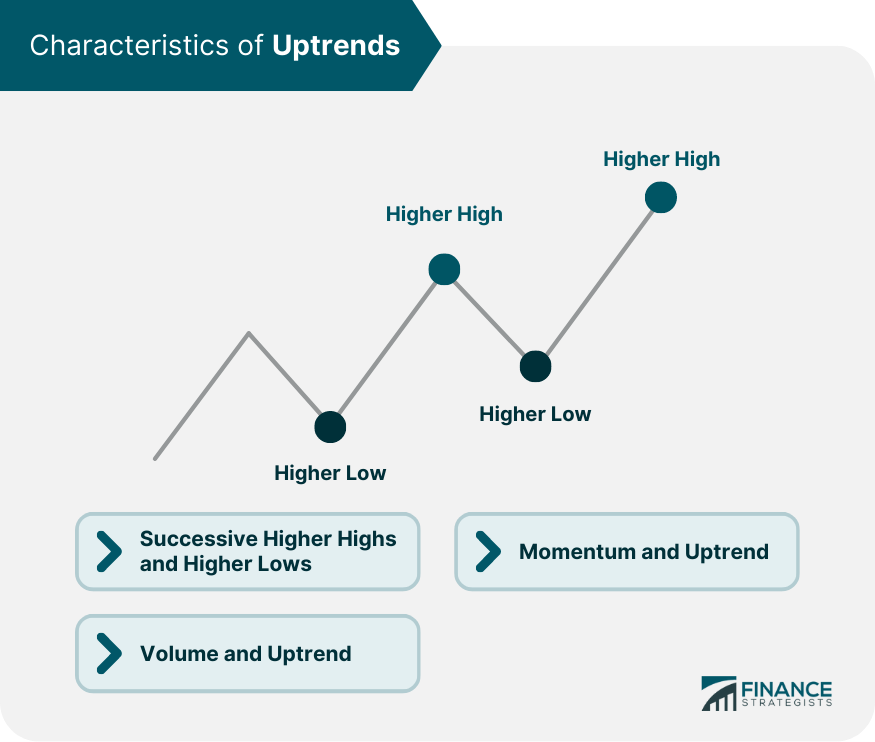
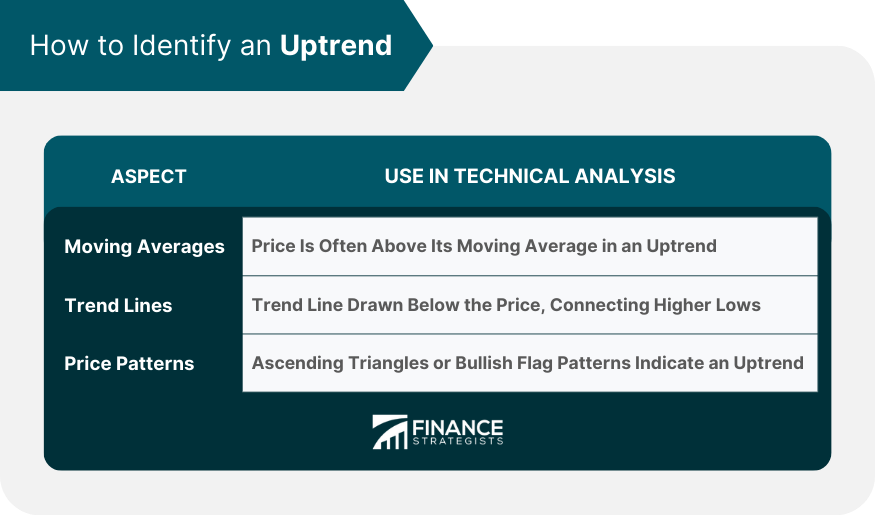
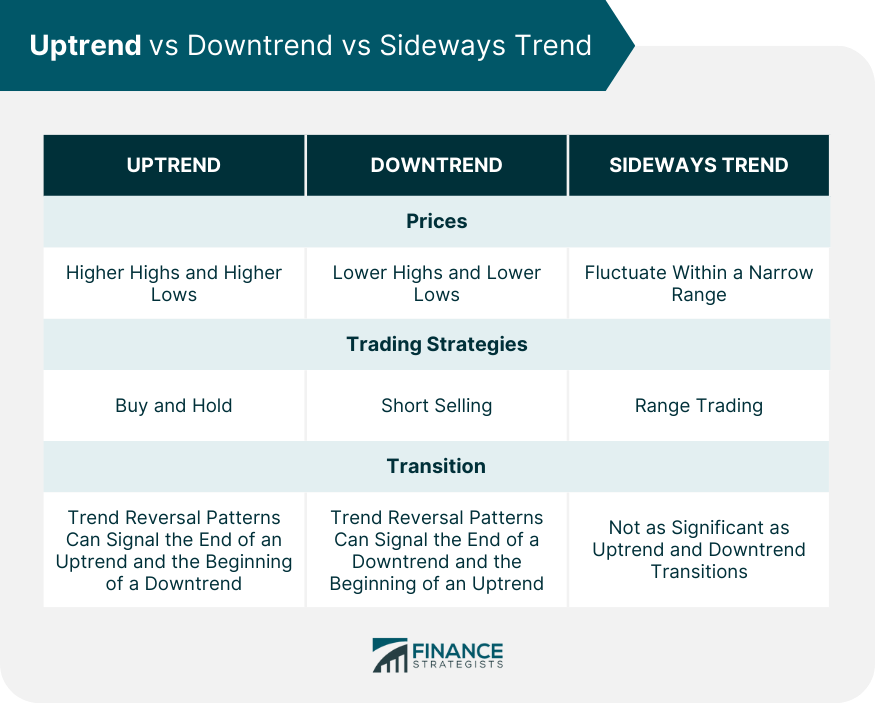
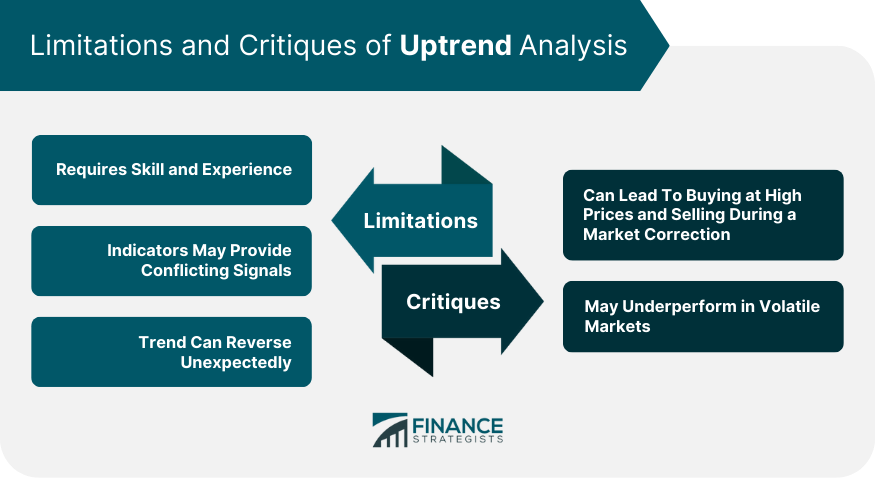
An uptrend refers to the overall upward trajectory of a financial asset's price over time. It's a basic term used in technical analysis, indicating a sustained increase in prices, often punctuated by higher highs and higher lows. The purpose of identifying an uptrend is to understand the market's bullish sentiment, providing a signal to investors that it might be an opportune time to buy or hold the asset. Recognizing an uptrend significantly impacts investors and traders, as it aids in making informed decisions based on the prevailing market conditions. It suggests potentially profitable opportunities, underlining the importance of timing in investments. In broader economic contexts, uptrends could also indicate positive business conditions, consumer confidence, or strong economic performance. Understanding the concept of an uptrend is essential for anyone engaged in financial markets, as it forms a fundamental part of investment and trading strategies. The primary characteristic of an uptrend is the formation of successive higher highs and higher lows in the price of an asset. This pattern suggests the asset's value is increasing over time, making it an attractive investment. Volume plays a significant role in confirming an uptrend. In general, volume tends to increase as the price moves higher and decreases as the price pulls back. This suggests that buyers are more aggressive during price advances and sellers are more cautious during price declines. Momentum is another key characteristic of an uptrend, implying the speed at which the price of an asset increases or decreases for a set of returns. Strong and growing momentum often accompanies an uptrend, reaffirming bullish market sentiment. A moving average, one of the most popular tools in technical analysis, smoothens out price data to identify the market trend. In an uptrend, the price is often above its moving average, with the moving average line also sloping upwards. Trend lines are another commonly used tool. In an uptrend, a trend line is drawn below the price, connecting at least two higher lows. The price is expected to bounce off the trend line and continue moving higher. Specific price patterns, such as ascending triangles or bullish flag patterns, can also indicate the presence of an uptrend. These patterns signal a continuation of the bullish market sentiment, leading to further increases in price. Strong economic indicators, like low unemployment rates and robust GDP growth, often coincide with market uptrends. As economic conditions improve, companies perform better, leading to higher stock prices. Positive corporate earnings reports, low debt levels, and other strong financial metrics can often signal the start or continuation of an uptrend. Positive news or favorable policy changes can stimulate buying, leading to an uptrend. Therefore, staying updated with market news is essential for identifying an uptrend early. The most common mistake is confirmation bias, where investors and traders only pay attention to information that supports their existing beliefs. Other mistakes include overreliance on a single indicator and failing to account for the overall economic and market context. In an uptrend, the old adage "buy low and sell high" translates to buying at the 'higher lows' and selling at the 'higher highs.' It's essential to use stop-loss orders to limit potential losses if the trend reverses. Even in an uptrend, there can be moments when selling is strategic. For instance, swing traders may sell at higher highs and buy back at higher lows. These include diversifying your investments, using stop-loss and take-profit levels, and not investing more than you can afford to lose. While an uptrend involves higher highs and higher lows, a downtrend is marked by lower highs and lower lows. In a sideways trend, also known as a horizontal trend, the market is relatively stable, with prices fluctuating within a narrow range. Trading strategies vary with each trend. In uptrends, a typical strategy is to 'buy and hold', while in downtrends, short selling could be profitable. During a sideways trend, range trading strategies are often effective. These transitions are significant for traders. Trend reversal patterns, like head and shoulders or double tops, can signal the end of an uptrend and the beginning of a downtrend. In a sustained uptrend, investors might lean more toward stocks and other growth-oriented assets. The key is to balance risk and return and not overexpose the portfolio to a single asset class. Even in an uptrend, diversification is critical to mitigating risks. Investors should spread their investments across different sectors that are performing well. For long-term investors, recognizing and leveraging uptrends can significantly enhance returns. However, it's also crucial to understand that uptrends are part of larger market cycles. The Efficient Market Hypothesis suggests that at any given time, asset prices fully reflect all available information, making it impossible to consistently achieve higher-than-average returns. However, proponents of technical analysis argue that price trends, like uptrends, can exist in the short term due to market psychology. The Random Walk Theory states that stock price changes are random and unpredictable. It implies that trends like uptrends are illusions and not useful for predicting future price movements. Behavioral finance acknowledges that market participants are not always rational, and their decisions can be influenced by cognitive biases. This could help explain why uptrends (and downtrends) occur, as investors tend to follow the herd. Identifying an uptrend require skill and experience. Indicators may provide conflicting signals, and the trend can reverse unexpectedly. Hence, relying solely on uptrend analysis may lead to inaccurate predictions and potential losses. Some critics argue that trend-following strategies, like buying in an uptrend, can lead to buying at high prices and selling during a market correction. They suggest these strategies might underperform in volatile markets. Overreliance on uptrends may result in overlooking fundamental factors that drive asset prices. Moreover, it could lead to excessive trading and risk-taking, particularly in volatile markets. Uptrends, characterized by successive higher highs and higher lows in an asset's price, is integral to understanding market dynamics. Identification techniques, such as technical analysis using moving averages, trend lines, and price patterns, alongside fundamental analysis, aid in navigating these bullish market conditions. Nonetheless, caution is warranted due to common pitfalls like confirmation bias and overreliance on a single indicator. In trading, strategies differ across uptrends, downtrends, and sideways trends, emphasizing the need for diversification and risk management. Theoretical perspectives, including Efficient Market Hypothesis and Behavioral Finance, provide insightful viewpoints on uptrends. Despite some limitations and criticisms, uptrend analysis remains crucial, especially with the rise of AI and machine learning, offering more precise trend identification. Understanding global economic influences and evolving trading strategies are also vital to effectively leverage uptrends for profitable investment decisions.What Is an Uptrend?
Characteristics of Uptrends
Successive Higher Highs and Higher Lows
Volume and Uptrend
Momentum and Uptrend

Identifying an Uptrend
Use of Technical Analysis
Moving Averages
Trend Lines
Price Patterns

Use of Fundamental Analysis
Economic Indicators
Company Financials
Market News
Common Mistakes in Identifying Uptrends
Trading in an Uptrend
Buying in an Uptrend
Selling in an Uptrend
Risk Management Strategies
Uptrend vs Downtrend vs Sideways Trend
Characteristics Comparison
Trading Strategies for Different Trends
Transition From Uptrend to Downtrend and Vice Versa

Uptrend in Portfolio Management
Asset Allocation
Diversification
Long-term Investment Strategies
Theoretical Perspectives on Uptrends
Efficient Market Hypothesis and Uptrends
Random Walk Theory and Uptrends
Behavioral Finance and Uptrends
Limitations and Critiques of Uptrend Analysis
Challenges in Identifying Uptrends
Critiques of Trend-Following Strategies
Pitfalls of Overreliance on Uptrends

Bottom Line
Uptrend FAQs
An uptrend in finance refers to a market condition where the price of an asset consistently moves upward over a specific period of time, indicating bullish sentiment.
You can identify an uptrend by looking for successive higher highs and higher lows in the asset's price. Technical analysis tools like moving averages, trend lines, and price patterns can help confirm the presence of an uptrend.
The key characteristics of an uptrend include the formation of higher highs and higher lows, increasing trading volume during price advances, and strong momentum supporting the upward price movement.
In an uptrend, a common strategy is to buy at higher lows and sell at higher highs. Implementing proper risk management techniques, such as using stop-loss orders, is crucial to protect against potential reversals.
Uptrends can be valuable for long-term investment strategies, but it's essential to consider other factors such as economic indicators, company financials, and market news. Diversification and a balanced approach to asset allocation are also important for long-term success.
True Tamplin is a published author, public speaker, CEO of UpDigital, and founder of Finance Strategists.
True is a Certified Educator in Personal Finance (CEPF®), author of The Handy Financial Ratios Guide, a member of the Society for Advancing Business Editing and Writing, contributes to his financial education site, Finance Strategists, and has spoken to various financial communities such as the CFA Institute, as well as university students like his Alma mater, Biola University, where he received a bachelor of science in business and data analytics.
To learn more about True, visit his personal website or view his author profiles on Amazon, Nasdaq and Forbes.


