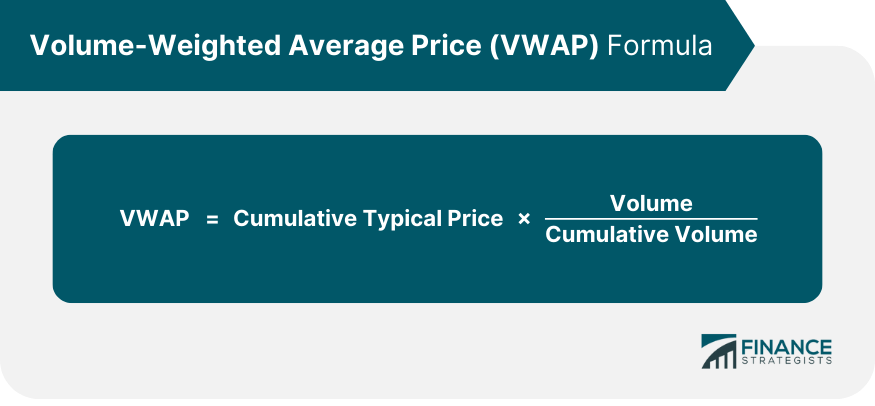
The Volume-Weighted Average Price (VWAP) is a technical analysis tool used in financial markets to assess intraday price action. Unlike a simple arithmetic average, it accounts for the volume of securities traded at a specific price, hence providing a more accurate reflection of the security's average trading price during a day. VWAP offers valuable insights into a security's trading behavior and serves as a benchmark to evaluate trading efficiency. If a trade is executed at a price markedly different from the VWAP, it could suggest a need for more efficient trade handling. In essence, VWAP helps traders understand the true average price of a security, preventing them from being misguided by unusual price movements unsupported by significant volume. The VWAP is determined by adding up the total dollar value of all transactions (price multiplied by volume) and dividing it by the total number of shares traded. It can be calculated using the formula: The Typical Price is obtained by adding the high price, low price, and closing price, and then dividing the sum by three. The term "cumulative" refers to the total value since the start of the trading session. To calculate the VWAP, you can simply add the VWAP indicator to a live chart, which will automatically perform the calculation. However, if you wish to calculate it manually, follow these steps: Assume a five-minute chart (the process is the same regardless of the chosen intraday time frame). Determine the average price at which the stock traded during the first five-minute period of the day. To do this, add the high, low, and closing prices and then divide the sum by three. Multiply this result by the volume traded during that period. Record the obtained value in a spreadsheet under a column labeled "PV" (Price multiplied by Volume). Divide the PV value by the volume traded during that period to calculate the VWAP for that specific period. To maintain the VWAP value throughout the day, continue adding the PV values from each subsequent period to the previous cumulative total. Then, divide this cumulative total by the total volume traded up to that point in time. At the start of each new trading session, VWAP resets to zero and begins to compute the average price afresh. This is done to ensure that VWAP accurately reflects the average price of a security for that specific trading day. The resetting of VWAP is particularly important as it ensures that the measure does not get skewed by price movements from previous trading sessions. On an intraday chart, VWAP appears as a single line that changes its position with each new transaction. This line is often smoother than a typical moving average line, providing a cleaner representation of the average price. It's important to note that the VWAP line only moves when a new transaction is recorded, and not merely when a new price is quoted. While VWAP may appear similar to a moving average on a chart, there are significant differences between these two measures. The most notable difference is that, unlike a moving average, VWAP gives more weight to prices with higher volume. This makes VWAP a more accurate reflection of the true average price. Another key difference is that VWAP resets at the start of each new trading session, while a moving average continues to compute an average price across multiple trading sessions. VWAP can provide valuable insights into both the price trends and value of a security. When the current price of a security is above the VWAP line on a chart, it indicates that the security is trading at a premium compared to its average price for the day. Conversely, if the current price is below the VWAP line, it shows that the security is trading at a discount. Furthermore, if a security’s price continually stays above or below the VWAP line, it could indicate persistent buying or selling pressure respectively. This can be used to identify potential price trends. VWAP is particularly useful in determining intraday price trends. By providing a benchmark that reflects the true average price, it can help traders identify whether a security is likely to be on an upward or downward trend during the course of a trading day. Traders often look for divergences between the VWAP and the current price to identify potential trading opportunities. For instance, if a security's price is below the VWAP but begins to move upward toward it, this could be a bullish signal. VWAP is an invaluable tool for short-term traders as it allows them to evaluate intraday price trends more accurately. By comparing the current price of a security with its VWAP, traders can gauge whether a security is being actively bought or sold during a trading day. Moreover, VWAP can also serve as a useful tool in trade execution. By aiming to buy below the VWAP or sell above it, traders can attempt to achieve better-than-average prices for their trades. This can be particularly valuable in highly volatile markets where prices can deviate significantly from the average. In summary, VWAP is a powerful tool in the world of trading, providing a more accurate measure of the average price of a security. Its applications range from identifying price trends to evaluating trade execution efficiency. Whether you are a short-term trader or a more long-term investor, understanding and using VWAP can provide valuable insights into the dynamics of financial markets. Traders often use VWAP as part of their strategy when executing trade orders. By comparing the current market price with the VWAP, traders can determine whether the current price offers good value. If the market price is below the VWAP, traders may see this as a buying opportunity. Conversely, if the market price is above the VWAP, it may be considered an opportunity to sell. Additionally, because the VWAP reflects the true average price of a security, it can help traders avoid making trades at inopportune times. For example, a trader might use the VWAP to avoid buying a security when the market price is inflated by a short-term surge in demand. VWAP is also commonly used as a benchmark to evaluate the effectiveness of a trading strategy or the efficiency of a trade execution. By comparing the average execution price of a trade with the VWAP, traders can gauge whether they are buying or selling securities at favorable prices. If the average execution price is below the VWAP for a purchase or above the VWAP for sale, it may indicate that the trader is executing trades efficiently. In recent years, algorithmic trading has become increasingly popular, and VWAP has found a prominent role in many algorithmic trading strategies. Because VWAP reflects the true average price of a security, it can help algorithmic trading systems to identify optimal trading opportunities. Many algorithmic trading systems use VWAP as a trigger for trading signals. For instance, an algorithmic trading system might be programmed to generate a buy signal when the market price drops below the VWAP and a sell signal when the market price rises above the VWAP. Incorporating VWAP into your trading strategy comes with several benefits but also some limitations and risks. Here are some of the key issues to consider. The first limitation of VWAP is that it is strictly an intraday indicator. This means that it is only applicable for trading within a single day. At the end of each trading day, the VWAP calculation resets. This feature is due to the indicator's design, which is to represent the average price of a security over a trading day based on both volume and price data. This makes the VWAP indicator less useful for traders or investors who prefer to hold positions over longer periods, such as swing traders or long-term investors. These traders may require analysis of price trends over multiple days, weeks, or even months, and therefore, they might prefer other indicators that cater to longer timeframes. Another risk when using VWAP in your trading strategy is the potential to rely on it too heavily. Like all trading indicators, VWAP is not foolproof and should not be used in isolation. It is always wise to use VWAP in conjunction with other technical analysis tools and indicators to confirm trading signals. Some traders use VWAP along with moving averages or momentum indicators to get a fuller picture of market trends. By doing so, traders can make more informed trading decisions and mitigate the risk of making a decision based on potentially misleading signals from a single indicator. Additionally, traders should be aware that VWAP is a lagging indicator. This means that it's calculated using past data, so it might not always predict future price movements accurately. Therefore, while VWAP can provide a good sense of a security's average price throughout the day, it might not provide an accurate prediction of the price direction or magnitude of future movements. Volume-Weighted Average Price (VWAP) is a valuable tool in trading strategies, offering insights into price trends, security value, and trade execution efficiency. It helps identify if a security is trading at a premium or discount, determine intraday price trends, and provides potential trading opportunities. VWAP is particularly useful for short-term traders, allowing them to evaluate intraday price trends accurately and optimize trade execution. It serves as a benchmark for evaluating trade efficiency and is commonly used in algorithmic trading. However, VWAP has limitations, being strictly an intraday indicator and lagging in nature. It should be used in conjunction with other technical analysis tools and indicators to confirm signals and mitigate risks. Understanding VWAP and its applications can provide valuable insights into financial market dynamics.What Is Volume-Weighted Average Price (VWAP)?
Mechanics of VWAP
Understanding the VWAP Calculation

How VWAP Resets Every Trading Session
Appearance of VWAP on Intraday Charts
Differences Between VWAP and Moving Average
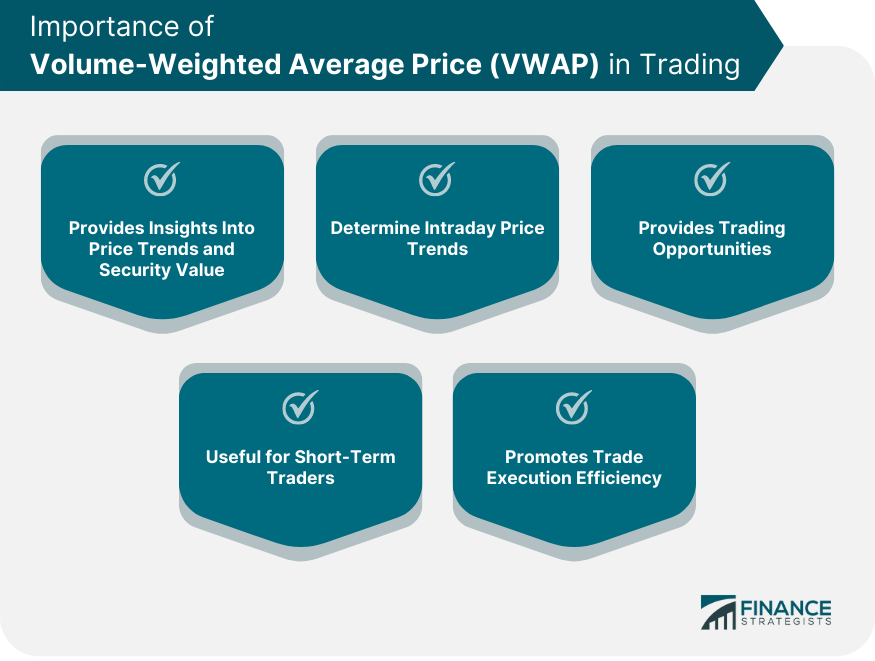
Importance of VWAP in Trading
How VWAP Provides Insight into Price Trends and Security Value
VWAP’s Role in Determining Intraday Price Trends
Why VWAP is Particularly Useful to Short-Term Traders

Application of VWAP in Trading Strategies
Using VWAP in Executing Trade Orders
VWAP as a Measure of Trade Execution Efficiency
Implementing VWAP in Algorithmic Trading
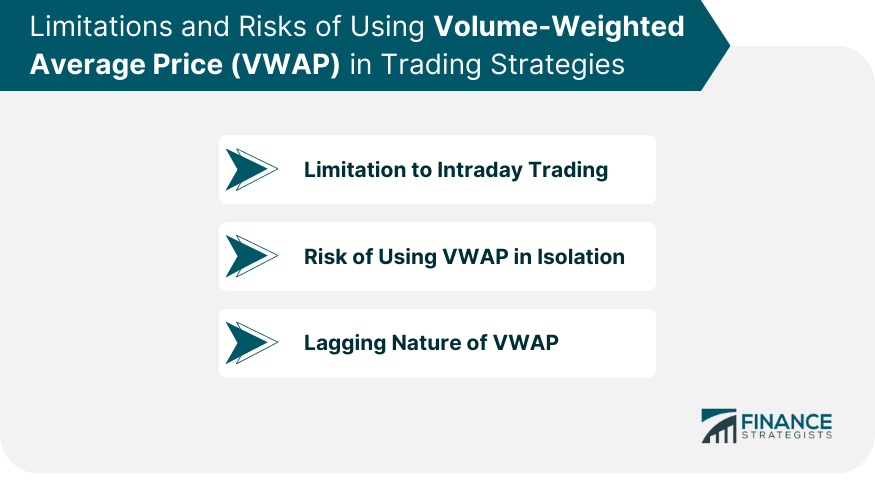
Limitations and Risks When Using VWAP in Trading Strategies
VWAP's Limitation to Intraday Trading
Risk of Using VWAP in Isolation
Lagging Nature of VWAP

Final Thoughts
Volume-Weighted Average Price (VWAP) FAQs
The Volume-Weighted Average Price (VWAP) is a technical indicator that shows the average price of a security, weighted by the volume of shares traded at each price point.
VWAP is calculated by multiplying the price of each transaction by its volume, summing these values, and then dividing by the total volume traded over a specified time period.
VWAP is important in trading because it provides a benchmark that helps traders understand if a security is being traded at a fair price. It is also used to assess trade execution performance.
VWAP is primarily used for intraday trading, as it provides an average price for a security over a single trading day. It is not typically used for long-term trading strategies.
VWAP is primarily a short-term, intraday indicator and does not reflect long-term price trends. Also, while it can provide valuable insights, it should not be used in isolation. Traders should use it in conjunction with other indicators and analysis tools.
True Tamplin is a published author, public speaker, CEO of UpDigital, and founder of Finance Strategists.
True is a Certified Educator in Personal Finance (CEPF®), author of The Handy Financial Ratios Guide, a member of the Society for Advancing Business Editing and Writing, contributes to his financial education site, Finance Strategists, and has spoken to various financial communities such as the CFA Institute, as well as university students like his Alma mater, Biola University, where he received a bachelor of science in business and data analytics.
To learn more about True, visit his personal website or view his author profiles on Amazon, Nasdaq and Forbes.


