The Zone of Support, in trading, refers to a price area where a downward price trend is anticipated to pause or reverse due to a surplus of demand or buying interest. This concept plays a vital role in technical analysis, helping traders pinpoint potential buying opportunities, manage risk, and forecast potential market reversals. With the advent of sophisticated trading technologies, such as algorithmic trading, machine learning, and AI, the relevance of the Zone of Support in trading strategies is gaining prominence. It's essential to note that Zones of Support, while crucial, should not be used in isolation, but rather in conjunction with other technical analysis tools and fundamental analysis. Traders often devise buying strategies when prices reach this Zone, while breakthroughs of support may indicate selling opportunities. The Zone of Support in trading is crucial as it represents a price level where a stock's downward trend is likely to pause due to increased demand or buying interest. When the price reaches this area, it tends to bounce back upwards, offering a potential buying opportunity. Thus, the support Zone can serve as an effective risk-management tool, helping traders to set stop losses and identify attractive entry points. It enhances decision-making abilities, thereby promoting profitable and sustainable trading strategies. The Zone of Support is grounded on the principle of supply and demand. When the price enters a support Zone, it suggests a surplus of demand or buying interest that could halt or reverse a downward trend. Various factors contribute to the creation of a Zone of Support. These can include previous price lows, Fibonacci retracement levels, and price reactions to significant news events. Market psychology significantly contributes to the formation of support Zones. When the price reaches these levels, the collective market sentiment may turn bullish, adding to the buying pressure. Several charting techniques can be used to identify a Zone of Support. These include trend lines, horizontal lines at previous lows, and candlestick patterns like hammers or bullish engulfing patterns. Numerous tools, such as trend lines, moving averages, and Fibonacci retracement levels, can help traders identify potential support Zones. Additionally, technical indicators like the Relative Strength Index (RSI) and Bollinger Bands can also suggest potential support levels. A single support level is a specific price at which buying is expected to increase, while a Zone of Support represents a range of prices where increased buying pressure is anticipated. This distinction offers traders a more adaptable approach to spotting potential reversal areas. When a price reaches a Zone of Support, it often results in a pause or reversal of the downward trend due to increased buying pressure. This could lead to a bounce back or even a trend reversal. Understanding Zones of Support can provide insights into the underlying strength of market trends. If a price repeatedly fails to fall below a support Zone, it may suggest a weakening downward trend. The strength of a support Zone can be gauged based on its historical significance, trading volume at these levels, and the behavior of technical indicators. The stronger the support Zone, the more significant the potential reversal. Traders often look to buy or go long when the price reaches a support Zone. On the flip side, if a price breaks through a support Zone with high volume, it can signal a selling opportunity as it may indicate the start of a new downward trend. Implementing appropriate risk management strategies is vital when trading around support Zones. Traders often set stop-loss orders just below the support Zone to limit potential losses if the price breaks through the support and continues to decline. Strategically, traders may plan to exit short positions or enter long positions as the price enters a support Zone. Recognizing the support Zone ahead of time can optimize potential profits and minimize risk. The concept of support Zones is relevant in all market conditions—bull markets, bear markets, and sideways markets. Grasping how to support Zones function in varying conditions can help traders adapt their strategies accordingly. Algorithmic trading has heightened the importance of support Zones. Many trading algorithms are programmed to detect these Zones and make trades based on them, enhancing the need for traders to understand these Zones. Support Zones often interact with other technical indicators. For instance, an oversold reading on the RSI combined with a price entering a support Zone could signify a potential buying opportunity. While support Zones are a valuable tool, they shouldn't be used in isolation. Other factors such as overall market conditions and fundamental analysis should also be considered. A common misinterpretation is that a price will always bounce back at a support Zone. While support Zones do suggest potential reversal points, they're not a guarantee, and prices can sometimes break through these Zones. To surmount these limitations, traders should use support Zones alongside other technical analysis tools and fundamental analysis. Proper risk management techniques should also be deployed to safeguard against potential losses. The Zone of Support represents an area on a price chart where a downward trend is expected to pause or reverse due to increased demand or buying interest. Its understanding and application are fundamental to successful trading. Embracing advanced concepts in the Zone of Support, including its relevance in varying market conditions, role in algorithmic trading, and interaction with other technical indicators, can further sharpen a trader's decision-making process. Moreover, its integration into trading strategies is instrumental in risk management and identifying profitable entry and exit points. The Zone of Support, similar to the Zone of Resistance, enables traders to harness the dynamics of supply and demand in markets, optimizing their strategies for better returns. It's understanding and proper utilization serve as stepping stones to successful trading.Definition of the Zone of Support
Importance of the Zone of Support in Trading
Understanding the Concept of the Zone of Support
Theoretical Framework for the Zone of Support
Factors Contributing to the Formation of the Zone of Support
Role of Market Psychology in the Zone of Support
Identifying the Zone of Support
Charting Techniques for Identifying the Zone of Support
Tools and Indicators Helpful in Recognizing the Zone of Support
Difference Between a Zone of Support and a Single Support Level
Interpreting the Zone of Support
The Implication of Zone of Support on Price Movement
Zone of Support and Market Trends
Evaluating the Strength of the Zone of Support
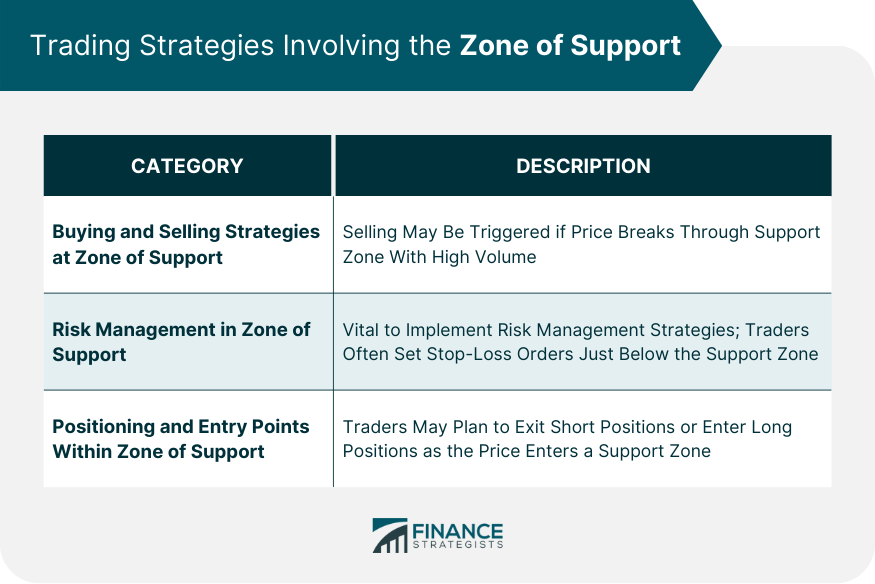
Trading Strategies Involving the Zone of Support

Buying and Selling Strategies in the Zone of Support
Risk Management in the Zone of Support
Positioning and Entry Points Within the Zone of Support
Advanced Topics in the Zone of Support
Zone of Support in Different Market Conditions
Zone of Support and Algorithmic Trading
Interaction Between Zone of Support and Other Technical Indicators
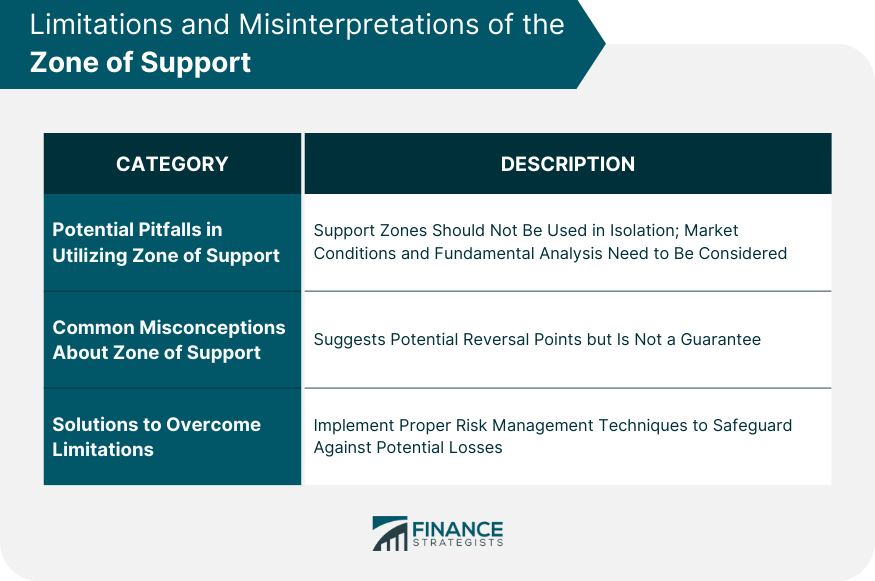
Limitations and Misinterpretations of the Zone of Support

Potential Pitfalls in Utilizing the Zone of Support
Common Misconceptions About the Zone of Support
Solutions to Overcome These Limitations
Conclusion
Zone of Support FAQs
The 'Zone of Support' in trading is a price level or area on a chart where a stock's price is likely to stop falling and bounce back up, due to increased demand or buying interest.
The 'Zone of Support' is important in trading because it helps traders predict where a downward price trend may stop and rebound. It assists in risk management by offering a guide for setting stop losses and identifying attractive buying opportunities.
The 'Zone of Support' can be identified by analyzing a price chart and spotting areas where the price has historically bounced back after a downward trend. It often appears as a horizontal band where the price has stopped and reversed several times.
The 'Zone of Support' aids in creating trading strategies by providing insight into potential turning points in a stock's price. Traders can use this information to decide when to enter or exit trades, and where to set their stop loss orders.
Yes, the Zone of Support' can fail. If a price breaks through the support Zone, it may continue to fall until it finds another support level. Hence, it's essential for traders to use additional indicators and strategies to confirm trading signals.
True Tamplin is a published author, public speaker, CEO of UpDigital, and founder of Finance Strategists.
True is a Certified Educator in Personal Finance (CEPF®), author of The Handy Financial Ratios Guide, a member of the Society for Advancing Business Editing and Writing, contributes to his financial education site, Finance Strategists, and has spoken to various financial communities such as the CFA Institute, as well as university students like his Alma mater, Biola University, where he received a bachelor of science in business and data analytics.
To learn more about True, visit his personal website or view his author profiles on Amazon, Nasdaq and Forbes.


