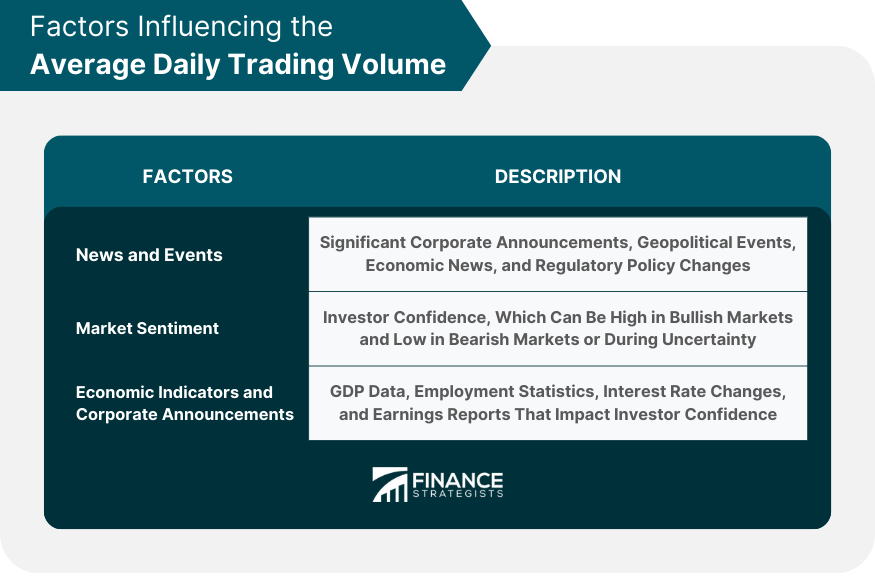
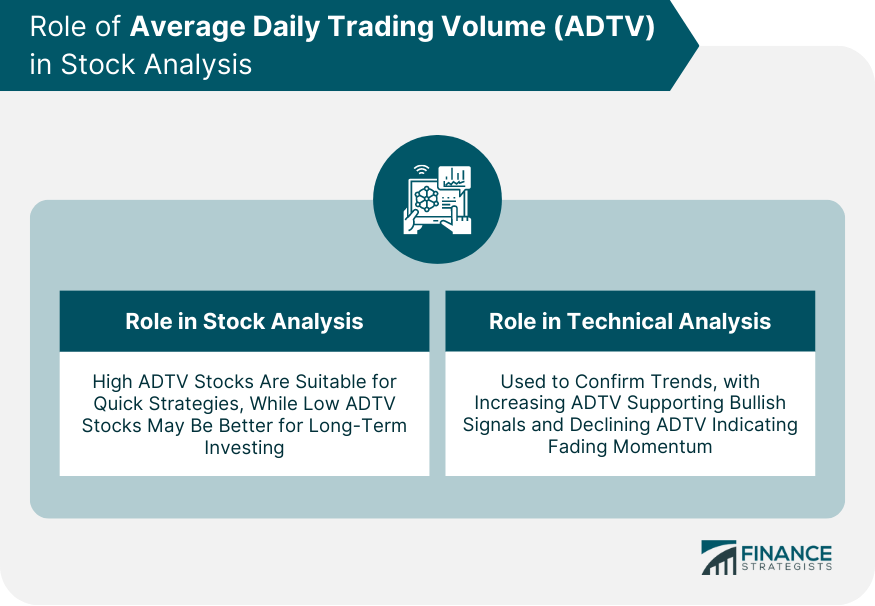
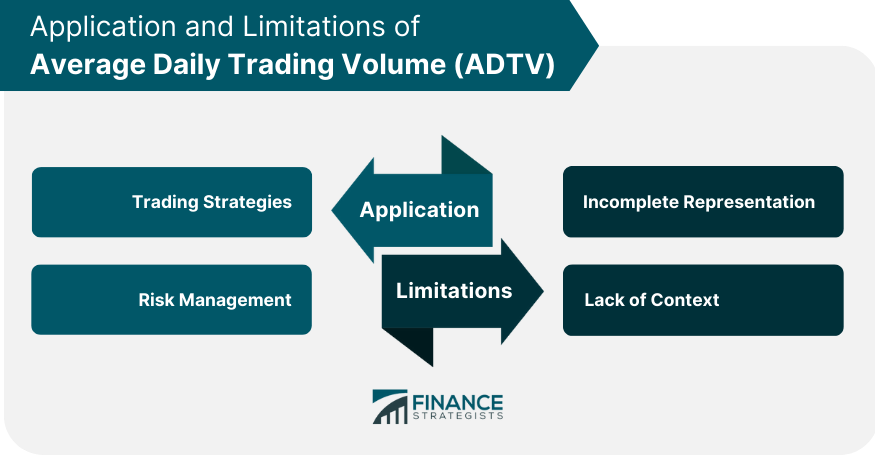
The Average Daily Trading Volume is a crucial metric in financial markets, indicating the average number of individual securities traded each day over a predetermined period. It helps in assessing the market's depth, stability, and investor sentiment. The ADTV is influenced by several factors, including major news events, market sentiment, and various economic indicators. However, ADTV also has its limitations and criticisms. It can potentially be misleading if used as the only indicator, as sudden spikes in ADTV could be due to one-time events rather than sustained investor interest. ADTV does not differentiate between buying and selling activity, which may lead to misinterpretations of market sentiment. ADTV is an essential barometer of market sentiment, often providing early signals of emerging trends. High trading volumes can indicate strong investor interest and a robust market, while low volumes may signal investor caution or a lack of confidence in the market or a particular security. ADTV is influenced by a range of factors, both predictable and unexpected. News and events often have a direct impact on trading volume. For example, significant corporate announcements—such as earnings releases, mergers and acquisitions—often trigger a surge in trading volume. Similarly, geopolitical events, economic news, and changes in regulatory policies can significantly influence the market's ADTV. The overall sentiment in the market also affects ADTV. In bullish markets, when investor confidence is high, trading volumes typically increase. Conversely, in bearish markets or times of uncertainty, trading volumes may decrease as investors adopt a wait-and-see approach. Economic indicators and corporate announcements—such as GDP data, employment statistics, interest rate changes, or earnings reports—can drive trading volumes by affecting investor confidence and market sentiment. The Average Daily Trading Volume is a fundamental measure of liquidity in financial markets. Liquidity refers to the ease with which a security can be bought or sold without causing significant price fluctuations. A higher ADTV suggests a more liquid market, as it indicates a larger number of securities being regularly traded. This is attractive to investors as it allows for smoother entry and exit from positions, minimizing the potential impact on prices. Conversely, a lower ADTV suggests lower liquidity, indicating a market where trading may cause more significant price changes. ADTV is a direct measure of market liquidity. A higher ADTV indicates a more liquid market, which is generally more attractive to investors as it allows for easier entry and exit without significantly affecting the price. Liquidity and ADTV are mutually reinforcing. A liquid market encourages more trading, which in turn increases ADTV. Conversely, a market with a low ADTV might deter trading, further reducing ADTV and liquidity. In trading, ADTV plays a crucial role in both stock analysis and strategy development. High ADTV stocks often indicate strong investor interest and liquidity, making them suitable for strategies requiring quick execution like day trading or high-frequency trading. Conversely, low ADTV stocks may be more appropriate for long-term investment strategies due to potentially higher transaction costs and price impacts. Furthermore, ADTV aids in risk management by helping traders estimate the liquidity risk associated with a particular security, thereby guiding informed decisions about position sizing and stop-loss orders. In technical analysis, ADTV is often used in conjunction with price movements to confirm trends. For example, an upward price trend accompanied by increasing ADTV is seen as a strong bullish signal. Conversely, if the price is rising but ADTV is declining, it may indicate that the trend is losing momentum. In fundamental analysis, ADTV is used as an indicator of market sentiment toward security. High ADTV might suggest strong investor interest, which could be due to positive fundamentals such as strong earnings or favorable market conditions. Market volatility refers to the rate at which security prices fluctuate, and it is often linked with Average Daily Trading Volume. Typically, there's a positive correlation between ADTV and market volatility. In highly volatile markets, trading volumes often surge as investors aim to capitalize on price swings or safeguard their portfolios. On the contrary, during periods of low volatility, trading volumes may decrease due to fewer opportunities for profit. Thus, ADTV can be seen as a barometer of market volatility, providing insights into the riskiness and dynamism of the market. Generally, there is a positive correlation between ADTV and market volatility. When markets are volatile, trading volumes often increase as investors seek to profit from price fluctuations or protect their portfolios against potential losses. Conversely, during periods of low volatility, trading volumes may decrease as there are fewer opportunities for profit. ADTV is not just a passive indicator; it also plays a pivotal role in shaping trading strategies and risk management. ADTV can influence the choice of trading strategies. For instance, high ADTV securities are suitable for strategies that rely on quick execution and tight spreads, such as day trading or high-frequency trading. On the other hand, low ADTV securities might be more appropriate for long-term investment strategies, given the potentially higher transaction costs and price impact of trades. ADTV is a critical factor in risk management. Traders often use it to estimate the liquidity risk of security - the risk that they may not be able to buy or sell the security quickly enough to prevent a loss or take a profit. By understanding the ADTV of security, traders can make more informed decisions about position sizing and stop-loss orders. ADTV, while a powerful tool, has its limitations and challenges. ADTV provides a snapshot of trading activity based on daily volume, but it may not capture the entire trading activity, especially in cases where significant trades occur outside regular market hours or in alternative trading venues. ADTV alone does not provide contextual information about the nature of trades, such as the types of participants or the significance of specific transactions. Without additional data, ADTV may not fully reflect the underlying dynamics and market conditions impacting liquidity. The Average Daily Trading Volume serves as a vital metric in financial markets, representing the average number of individual securities traded in a day over a specified period. Its value lies in the insights it offers about the market's depth, stability, and investor interest. Factors such as significant news events, market sentiment, and economic indicators, among others, play a crucial role in influencing ADTV. Despite its significance, ADTV is not without criticisms and limitations. Relying on it as a sole indicator can be misleading, and external factors such as changes in trading technology or regulations can affect it. Moreover, it does not distinguish between buying and selling activity, which can sometimes lead to misinterpretations of market sentiment. Nonetheless, when used in conjunction with other indicators, ADTV remains an indispensable tool in financial analysis.What Is the Average Daily Trading Volume (ADTV)?
Factors Influencing Average Daily Trading Volume

News and Events
Market Sentiment
Economic Indicators and Corporate Announcements
Average Daily Trading Volume and Liquidity
Relationship Between ADTV and Liquidity
How Liquidity Impacts ADTV
Average Daily Trading Volume in Stock Analysis
Role of ADTV in Technical Analysis
Role of ADTV in Fundamental Analysis

Average Daily Trading Volume and Market Volatility
Applications of Average Daily Trading Volume in Trading
Trading Strategies
Risk Management
Limitations of Average Daily Trading Volume
Incomplete Representation
Lack of Context

Conclusion
Average Daily Trading Volume (ADTV) FAQs
The Average Daily Trading Volume (ADTV) is a measure of the number of individual securities traded in a day over a specified period. It provides insights into the market's depth, stability, and investor sentiment.
Several factors influence ADTV, including news and events, market sentiment, and various economic indicators and corporate announcements. These elements can directly impact investor confidence and trading activity.
The ADTV does not differentiate between buying and selling activity, which can lead to misinterpretations of market sentiment. Also, it can be influenced by factors outside market dynamics, such as changes in trading technology or regulations.
In stock analysis, ADTV is used in both technical and fundamental analysis. It helps confirm trends and gauge market sentiment towards security. High ADTV can suggest strong investor interest, possibly due to positive market conditions or robust earnings.
There's usually a positive correlation between ADTV and market volatility. In volatile markets, trading volumes often increase as investors seek to profit from price fluctuations or protect their portfolios against potential losses.
True Tamplin is a published author, public speaker, CEO of UpDigital, and founder of Finance Strategists.
True is a Certified Educator in Personal Finance (CEPF®), author of The Handy Financial Ratios Guide, a member of the Society for Advancing Business Editing and Writing, contributes to his financial education site, Finance Strategists, and has spoken to various financial communities such as the CFA Institute, as well as university students like his Alma mater, Biola University, where he received a bachelor of science in business and data analytics.
To learn more about True, visit his personal website or view his author profiles on Amazon, Nasdaq and Forbes.


