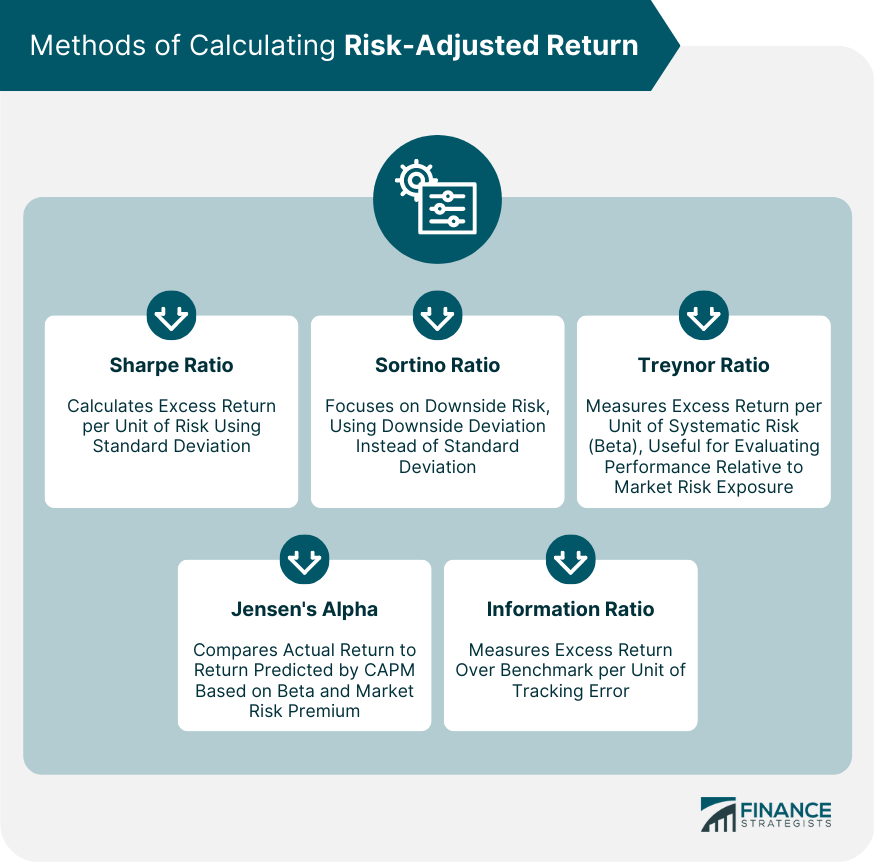
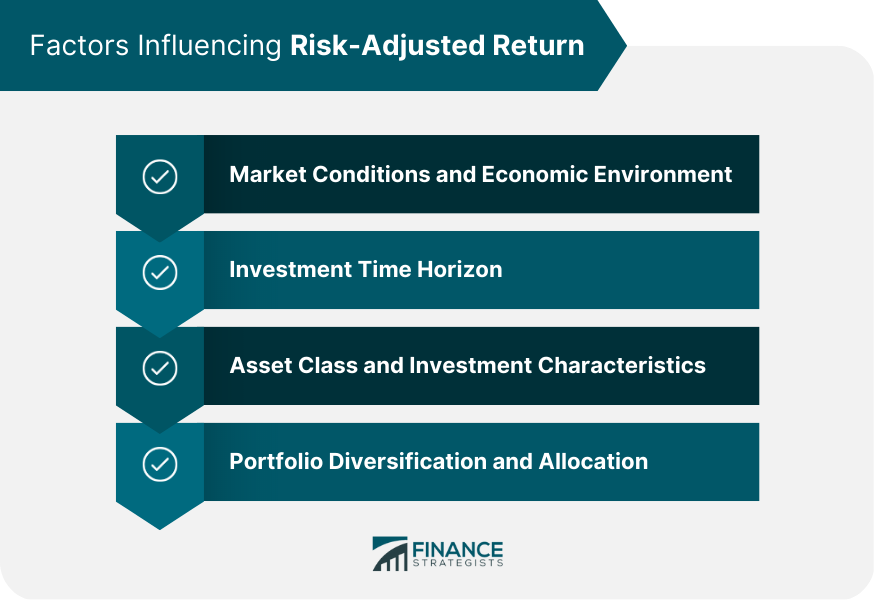
Risk-adjusted return is a measure of investment performance that takes into account both the return generated by an investment and the risk associated with it. By considering risk, this metric provides a more comprehensive picture of an investment's performance compared to traditional return measures, such as absolute return or total return. Risk-adjusted return is a critical metric for investors because it helps them evaluate and compare investments on a level playing field, considering both the potential rewards and risks. This enables investors to make more informed decisions when building and managing their portfolios, ultimately leading to better investment outcomes. The risk-adjusted return highlights the relationship between risk and return, emphasizing that higher returns often come with increased risk. By using this metric, investors can identify investments that offer the most attractive returns for a given level of risk, or conversely, the lowest risk for a given level of return. The Sharpe ratio, developed by Nobel laureate William F. Sharpe, is one of the most popular measures of risk-adjusted return. It calculates the excess return of an investment (the return above the risk-free rate) per unit of risk, as measured by standard deviation. A higher Sharpe ratio indicates a better risk-adjusted performance. The Sortino ratio is a variation of the Sharpe ratio that focuses on downside risk. Instead of using the standard deviation of returns, the Sortino ratio uses downside deviation, which measures the variability of negative returns only. This makes it more suitable for investors who are primarily concerned with downside risk. The Treynor ratio, developed by Jack L. Treynor, measures the excess return of an investment per unit of systematic risk, as represented by beta. This metric is useful for investors who want to evaluate the performance of an investment relative to its exposure to market risk. Jensen's Alpha, developed by Michael C. Jensen, measures the risk-adjusted performance of an investment by comparing its actual return to the return predicted by the Capital Asset Pricing Model (CAPM), based on the investment's beta and the market risk premium. A positive Jensen's Alpha indicates that an investment has outperformed its expected risk-adjusted return. The information ratio measures the risk-adjusted performance of an investment relative to a benchmark index. It calculates the excess return of an investment over the benchmark per unit of tracking error, which is the standard deviation of the difference between the investment's returns and the benchmark's returns. A higher information ratio indicates better risk-adjusted performance compared to the benchmark. Risk-adjusted return metrics can help investors evaluate the performance of individual investments by considering both their returns and associated risks. By comparing risk-adjusted returns, investors can identify which investments offer the most attractive opportunities based on their risk tolerance. Risk-adjusted return metrics can also be used to compare investments across different asset classes, such as stocks, bonds, and alternative investments. By considering risk-adjusted returns, investors can make more informed decisions about asset allocation and diversification within their portfolios. Investors can use risk-adjusted return metrics to evaluate the performance of their portfolios or individual investments relative to benchmark indices or other investment alternatives. By comparing risk-adjusted returns, investors can assess whether their investments are meeting their expectations and determine if adjustments are needed to improve their portfolios' risk-adjusted performance. Risk-adjusted returns can be influenced by various factors, including market conditions and the broader economic environment. Factors such as interest rates, inflation, economic growth, and market volatility can all impact the risk and return characteristics of investments, leading to changes in risk-adjusted returns over time. The investment time horizon also plays a significant role in determining risk-adjusted returns. Generally, investments with longer time horizons tend to exhibit lower levels of risk, as short-term fluctuations in value are less relevant to the overall investment outcome. As a result, longer-term investments may have higher risk-adjusted returns compared to shorter-term investments. Different asset classes and investments have unique characteristics that can impact their risk-adjusted returns. For example, some asset classes, such as stocks, tend to have higher volatility and risk compared to bonds, which may result in differing risk-adjusted returns. Additionally, the specific attributes of individual investments, such as a company's financial health or a bond's credit quality, can also affect risk-adjusted returns. The level of diversification and asset allocation within an investor's portfolio can also influence risk-adjusted returns. By holding a well-diversified mix of investments, investors can potentially reduce the overall risk in their portfolios, which may lead to higher risk-adjusted returns. Conversely, a poorly diversified portfolio with high concentrations in specific investments or asset classes may exhibit lower risk-adjusted returns. Risk-adjusted return metrics can be used to optimize investment portfolios by identifying the most efficient combinations of assets that offer the highest risk-adjusted returns for a given level of risk or the lowest risk for a given level of return. By using these metrics, investors can create portfolios that align with their risk tolerance and investment objectives. Risk-adjusted return metrics can also be used to inform asset allocation decisions, helping investors determine the optimal mix of investments across different asset classes based on their risk and return characteristics. By considering risk-adjusted returns, investors can allocate their portfolios to achieve their desired level of risk-adjusted performance. Investors can use risk-adjusted return metrics to evaluate the performance of their portfolios or individual investments, attributing the sources of returns and risk to specific investments, asset classes, or portfolio strategies. This information can be valuable in identifying areas of strength and weakness within a portfolio and informing future investment decisions. Risk-adjusted return metrics rely on various assumptions and simplifications, which may not always hold true in practice. For example, these metrics often assume that investment returns are normally distributed or that historical risk and return characteristics will persist into the future. In reality, these assumptions may not always be accurate, which can limit the usefulness of risk-adjusted return metrics in certain situations. Accurately measuring risk can be a challenge, as different types of risk may not be fully captured by traditional risk measures, such as standard deviation or beta. As a result, risk-adjusted return metrics may not always provide a complete picture of an investment's risk profile, potentially leading to misinterpretations or suboptimal investment decisions. Risk-adjusted return metrics can sometimes be misinterpreted or misused by investors, leading to poor investment decisions. For example, investors may focus solely on maximizing risk-adjusted returns without considering other important factors, such as their risk tolerance, investment goals, or the specific characteristics of individual investments. Risk-adjusted return is an essential concept in investing, as it provides a more comprehensive picture of investment performance by considering both return and risk. By using risk-adjusted return metrics, investors can make more informed decisions about which investments to include in their portfolios and how to allocate their assets effectively. There are several methods for calculating risk-adjusted returns, including the Sharpe ratio, Sortino ratio, Treynor ratio, Jensen's Alpha, and Information ratio. Each of these metrics offers a unique perspective on investment performance, allowing investors to compare investments on a level playing field by considering both returns and associated risks. Risk-adjusted return plays a crucial role in portfolio management and investment decisions, helping investors optimize their portfolios, make informed asset allocation decisions, and evaluate investment performance relative to benchmarks or other investment alternatives. By focusing on risk-adjusted returns, investors can better align their investment strategies with their risk tolerance and investment objectives.What Is Risk-Adjusted Return?
Methods of Calculating Risk-Adjusted Return
Sharpe Ratio
Sortino Ratio
Treynor Ratio
Jensen's Alpha
Information Ratio

Comparing Investments Using Risk-Adjusted Return
Evaluating Individual Investments
Comparing Investments Across Asset Classes
Benchmarking and Performance Evaluation
Factors Influencing Risk-Adjusted Return
Market Conditions and Economic Environment
Investment Time Horizon
Asset Class and Investment Characteristics
Portfolio Diversification and Allocation

Risk-Adjusted Return in Portfolio Management
Portfolio Optimization
Asset Allocation Decisions
Performance Measurement and Attribution
Limitations of Risk-Adjusted Return
Assumptions and Simplifications
Challenges in Measuring Risk Accurately
Potential Misinterpretation and Misuse
Conclusion
Risk-Adjusted Return FAQs
Risk-adjusted return is a measure of the return earned by an investment, taking into account the level of risk associated with that investment. It considers the amount of risk taken on by an investor to achieve a certain level of return.
Risk-adjusted return is important as it allows investors to evaluate the performance of an investment in relation to the level of risk taken. It helps investors to make informed decisions about investment choices, as they can compare the performance of different investments on a risk-adjusted basis.
There are several ways to calculate risk-adjusted return, such as the Sharpe Ratio, Treynor Ratio, and Information Ratio. These ratios compare the return of an investment to a benchmark or the market, and then adjust for the level of risk taken on by the investor.
Yes, a high-risk investment can have a good risk-adjusted return if the return earned is higher than the amount of risk taken on by the investor. Risk-adjusted return takes into account the level of risk, so an investment that is riskier may still have a good risk-adjusted return if the return earned justifies the amount of risk taken.
Risk-adjusted return can be used as a valuable tool in investment decision-making. It allows investors to compare different investment options based on their risk-adjusted performance, helping them identify investments that have provided better returns relative to their level of risk. Investors can use risk-adjusted return to assess the suitability of investments based on their risk tolerance, investment goals, and overall portfolio diversification strategy.
True Tamplin is a published author, public speaker, CEO of UpDigital, and founder of Finance Strategists.
True is a Certified Educator in Personal Finance (CEPF®), author of The Handy Financial Ratios Guide, a member of the Society for Advancing Business Editing and Writing, contributes to his financial education site, Finance Strategists, and has spoken to various financial communities such as the CFA Institute, as well as university students like his Alma mater, Biola University, where he received a bachelor of science in business and data analytics.
To learn more about True, visit his personal website or view his author profiles on Amazon, Nasdaq and Forbes.


