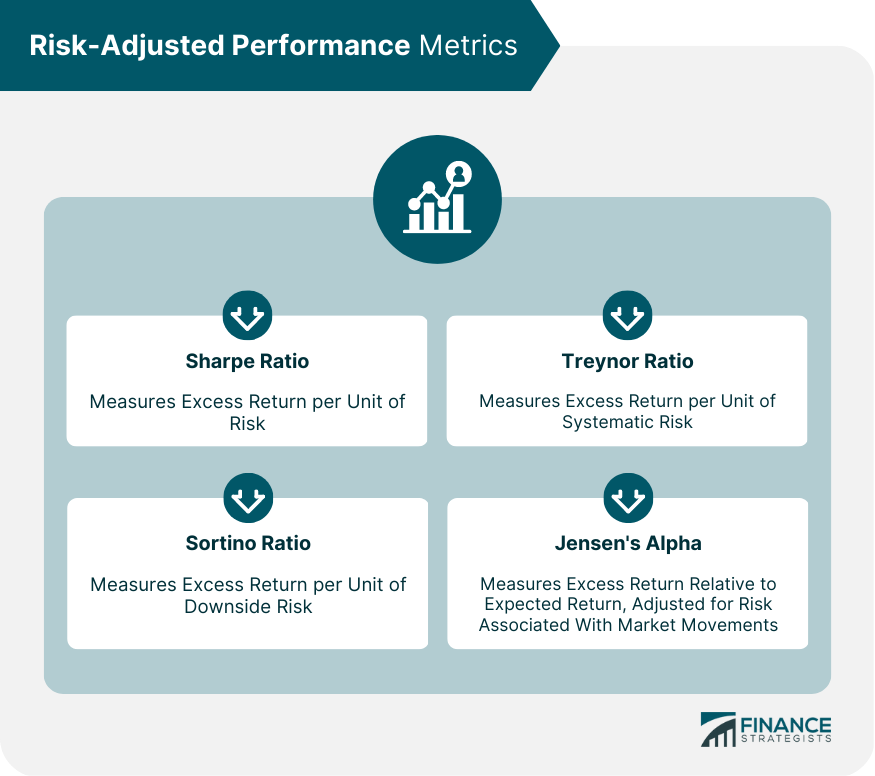
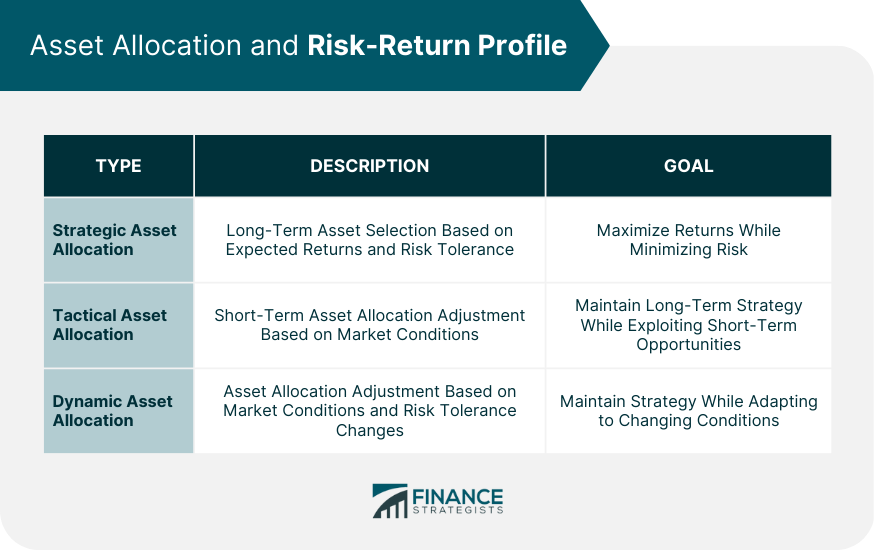
The risk-return profile of an investment refers to the trade-off between the potential returns and the risk of losing money. Higher returns typically come with higher risks, and investors must determine the level of risk they are willing to take on to achieve their desired returns. Analyzing the risk-return profile of an investment is essential for investors to make informed investment decisions. It helps investors to determine if an investment aligns with their investment goals and risk tolerance. By understanding the potential returns and the associated risks, investors can make better decisions about the allocation of their assets and the construction of their investment portfolios. The purpose of analyzing the risk-return profile is to determine the potential for an investment to meet an investor's investment objectives while considering the risks involved. Investors can use this analysis to select investments that align with their goals and risk tolerance, construct portfolios that optimize the risk-return trade-off, and monitor the performance of their investments over time. Expected return refers to the average return an investor can expect to receive from an investment over time. It is typically calculated as a percentage of the initial investment. Risk measures are used to quantify the risk associated with an investment. Some common risk measures include volatility, beta, value at risk (VaR), and conditional value at risk (CVaR). Volatility refers to the degree of variation in an investment's returns over time. A high degree of volatility indicates a high degree of risk. Beta measures the sensitivity of an investment's returns to market movements. A beta of 1 indicates that an investment's returns move in line with the market, while a beta greater than 1 indicates that an investment's returns are more volatile than the market. VaR measures the maximum potential loss an investment could experience within a given time frame at a specific level of confidence. For example, a VaR of 5% at a 95% confidence level means that there is a 5% chance that an investment could lose more than the VaR amount over the given time frame. CVaR, also known as expected shortfall, is a risk measure that estimates the expected loss beyond VaR in the event of extreme market movements. The risk-return trade-off is the relationship between the level of risk associated with an investment and the potential returns. Generally, investments with higher potential returns come with higher risks, and investments with lower potential returns come with lower risks. Investors must determine the level of risk they are willing to take on to achieve their desired returns. The efficient frontier represents the set of portfolios that offer the highest potential returns for a given level of risk. The efficient frontier can help investors to construct portfolios that optimize the risk-return trade-off. The risk-free rate represents the return an investor can expect to receive without taking on any risk. The capital market line (CML) represents the relationship between the risk-free rate and the efficient frontier. The CML is a line that connects the risk-free rate to the portfolio on the efficient frontier with the highest Sharpe ratio. The Sharpe ratio is a risk-adjusted performance metric that measures the excess return earned for each unit of risk taken on. Modern portfolio theory (MPT) is a framework that aims to maximize returns while minimizing risk by constructing portfolios that are diversified across multiple assets. MPT suggests that an investor can reduce the overall risk of their portfolio by selecting assets with low correlations to each other. Diversification is a strategy that involves investing in multiple assets to reduce risk. Correlation refers to the degree to which two assets move in relation to each other. Assets with low correlation to each other can help to reduce the overall risk of a portfolio. Portfolio optimization is the process of constructing a portfolio that maximizes returns while minimizing risk. Portfolio optimization involves selecting assets with different levels of risk and return and determining the optimal allocation of assets to achieve the desired risk-return trade-off. The Sharpe ratio measures the excess return earned for each unit of risk taken on. It is calculated by subtracting the risk-free rate from the portfolio return and dividing the result by the standard deviation of the portfolio's excess returns. The Sortino ratio is similar to the Sharpe ratio but focuses on downside risk. The Sortino ratio measures the excess return earned for each unit of downside risk taken on. The Treynor ratio measures the excess return earned for each unit of systematic risk taken on. Systematic risk refers to the risk associated with market movements. Jensen's alpha measures the excess return earned by a portfolio relative to its expected return, adjusted for the risk associated with market movements. Jensen's alpha can help investors to determine if a portfolio has outperformed or underperformed its expected returns. Strategic asset allocation is an asset allocation that involves selecting assets based on their long-term expected returns and the investor's risk tolerance. The goal of strategic asset allocation is to create a diversified portfolio that maximizes returns while minimizing risk. Tactical asset allocation involves adjusting the allocation of assets in a portfolio based on short-term market conditions. The goal of tactical asset allocation is to take advantage of short-term opportunities while maintaining a long-term strategic asset allocation. Dynamic asset allocation involves adjusting the allocation of assets in a portfolio based on changes in market conditions and the investor's risk tolerance. The goal of dynamic asset allocation is to adapt to changing market conditions while maintaining a long-term strategic asset allocation. An investment policy statement (IPS) is a document that outlines an investor's investment goals, risk tolerance, and investment strategy. The risk-return profile plays a crucial role in the development of an IPS. Assessing an investor's risk tolerance is essential to determine the level of risk they are willing to take on to achieve their desired returns. The risk-return profile can help investors to determine their risk tolerance and construct portfolios that align with their investment goals. Asset selection and portfolio construction involve selecting assets with different levels of risk and return and determining the optimal allocation of assets to achieve the desired risk-return trade-off. The risk-return profile plays a crucial role in asset selection and portfolio construction. One of the biggest limitations of risk-return analysis is the difficulty in predicting future risk and return. Past performance is not always indicative of future results, and there are many factors that can impact the performance of an investment. Risk-return analysis is based on mathematical models that make assumptions about the behavior of markets and the relationship between assets. These models may not always accurately reflect real-world market conditions, and there is always the potential for model error. Investors are subject to behavioral factors and emotional biases that can impact their investment decisions. These biases can lead investors to take on too much or too little risk, leading to suboptimal investment outcomes. Analyzing the risk-return profile of an investment is crucial for investors to make informed investment decisions. Understanding the potential for returns and the associated risks helps investors to select investments that align with their goals and risk tolerance, construct portfolios that optimize the risk-return trade-off, and monitor the performance of their investments over time. While there are limitations and challenges to risk-return analysis, investors can use best practices such as diversification, portfolio optimization, and risk-adjusted performance metrics to manage their risk-return profiles effectively. Future trends and innovations in risk-return analysis will continue to help investors make better-informed investment decisions.What Is the Risk-Return Profile?
Components of Risk-Return Profiles
Expected Return
Risk Measures
Volatility (Standard Deviation)
Beta
Value at Risk (VaR)
Conditional Value at Risk (CVaR)
Risk-Return Trade-off
Concept of Risk-Return Trade-off
Efficient Frontier
Risk-Free Rate and the Capital Market Line
Portfolio Theory
Modern Portfolio Theory (MPT)
Diversification and Correlation
Portfolio Optimization
Risk-Adjusted Performance Metrics
Sharpe Ratio
Sortino Ratio
Treynor Ratio
Jensen's Alpha

Asset Allocation and Risk-Return Profile
Strategic Asset Allocation
Tactical Asset Allocation
Dynamic Asset Allocation

Role of Risk-Return Profiles in Investment Decisions
Investment Policy Statement (IPS)
Risk Tolerance Assessment
Asset Selection and Portfolio Construction
Limitations and Challenges
Predicting Future Risk and Return
Model Limitations
Behavioral Factors and Emotional Biases
Conclusion
Risk-Return Profile FAQs
A risk-return profile refers to the trade-off between the potential returns and the risk of losing money associated with an investment. It is important for investors to analyze the risk-return profile of an investment to determine if it aligns with their investment goals and risk tolerance. By understanding the potential returns and associated risks, investors can make better decisions about the allocation of their assets and the construction of their investment portfolios.
The components of a risk-return profile include the expected return of an investment and various risk measures, such as volatility (standard deviation), beta, value at risk (VaR), and conditional value at risk (CVaR).
The risk-return trade-off is the relationship between the level of risk associated with an investment and the potential returns. Investments with higher potential returns come with higher risks, and investments with lower potential returns come with lower risks. Investors must determine the level of risk they are willing to take on to achieve their desired returns. This trade-off impacts investment decisions by helping investors select investments that align with their goals and construct portfolios that optimize the risk-return trade-off.
Portfolio theory is a framework that aims to maximize returns while minimizing risk by constructing portfolios that are diversified across multiple assets. Portfolio theory is related to risk-return analysis as it suggests that an investor can reduce the overall risk of their portfolio by selecting assets with low correlations to each other.
Best practices for managing risk-return profiles include diversification, portfolio optimization, and the use of risk-adjusted performance metrics such as the Sharpe ratio, Sortino ratio, Treynor ratio, and Jensen's alpha. Additionally, investors should regularly monitor and adjust their portfolios to ensure that they continue to align with their investment goals and risk tolerance.
True Tamplin is a published author, public speaker, CEO of UpDigital, and founder of Finance Strategists.
True is a Certified Educator in Personal Finance (CEPF®), author of The Handy Financial Ratios Guide, a member of the Society for Advancing Business Editing and Writing, contributes to his financial education site, Finance Strategists, and has spoken to various financial communities such as the CFA Institute, as well as university students like his Alma mater, Biola University, where he received a bachelor of science in business and data analytics.
To learn more about True, visit his personal website or view his author profiles on Amazon, Nasdaq and Forbes.


