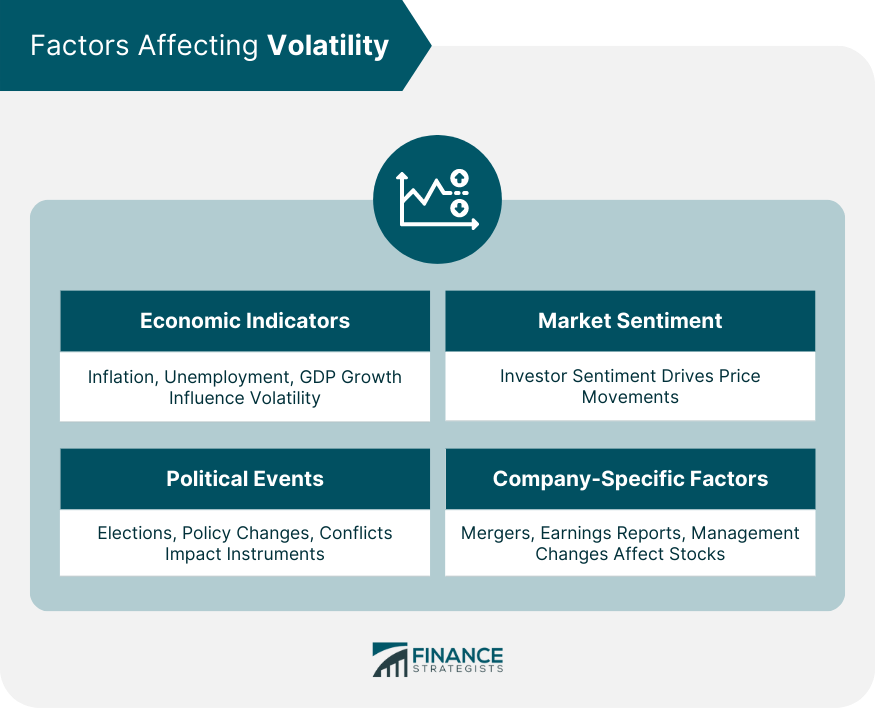
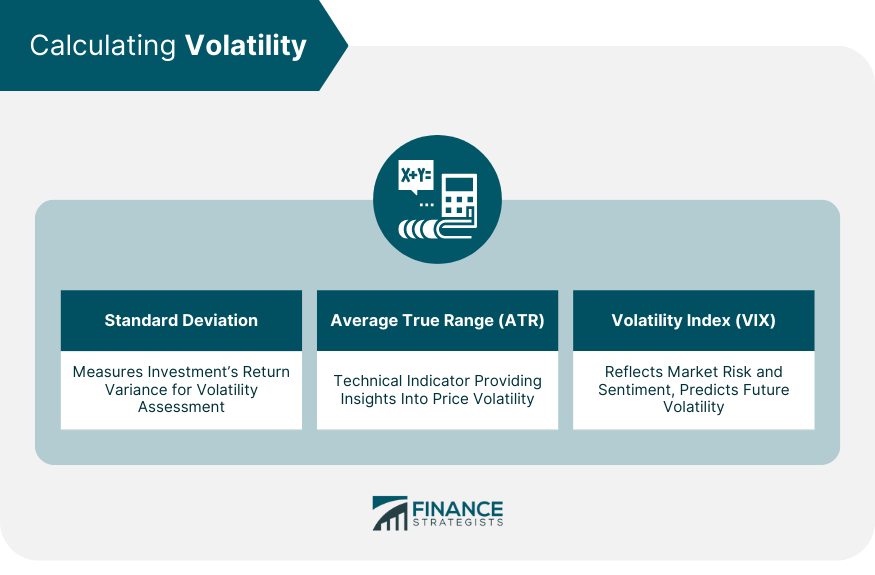
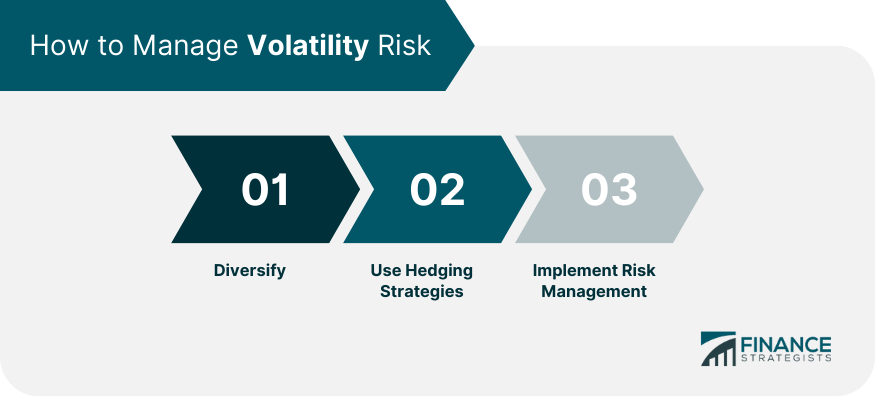
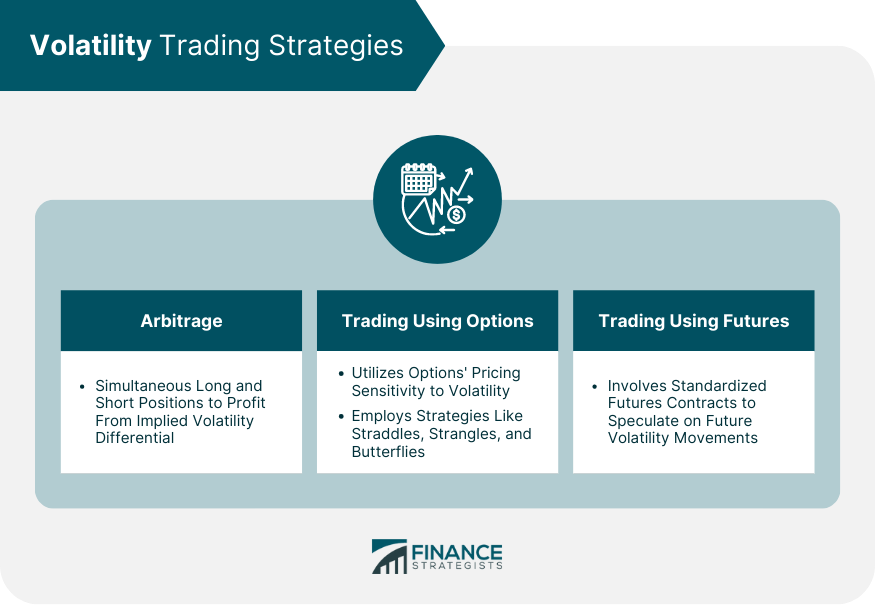
Volatility is the change in the performance of an investment over time. Volatility is calculated by measuring the standard deviation in the return of an investment, and it is often used to calculate an investment's risk. It essentially measures the degree of variation of an investment's price over time. Volatility is one of the most important factors an investor takes into consideration when managing their portfolio and evaluating new investments. For this reason, many metrics compare a unit of return against a unit of volatility, such as the Sharpe ratio, information ratio, and tracking error. Investors expect to be compensated extra for additional risk they incur. Higher volatility means that the price of the asset can change dramatically over a short time period in either direction, while lower volatility indicates steadier price movements. Economic indicators such as inflation rates, unemployment figures, and GDP growth can greatly influence the volatility of financial markets. Positive economic data might bolster investor confidence, leading to a surge in buying activity, while negative data can result in selling pressures. Investors often keep a close eye on these indicators, adjusting their portfolios accordingly to hedge against potential market shifts. Market sentiment, the general prevailing attitude of investors, can either be bullish (optimistic) or bearish (pessimistic). This sentiment plays a vital role in driving price movements. For instance, news of a breakthrough product can trigger a rush of positive sentiment, driving up a company's stock price. Conversely, negative press or pessimistic forecasts can incite selling, leading to increased volatility. Elections, changes in government policies, international conflicts, or even geopolitical tensions can introduce considerable uncertainty to the markets. Such events can create unpredictability in financial instruments, especially those directly impacted by the said events. For instance, defense stocks might see a surge during international conflicts, while trade wars can disrupt the stocks of companies relying heavily on imports or exports. Merger announcements, earnings reports, and management changes are some of the company-specific events that can introduce volatility in the stock of the concerned company. For example, surpassing earnings expectations can lead to a positive surge in the company's stock, while a merger announcement might lead to speculative trading, causing price fluctuations. Historical volatility gauges the fluctuations of underlying securities by analyzing price changes over predetermined periods. It provides a measure of past market movements and is often used as an indicator to understand the expected range of future price changes. Unlike historical volatility, implied volatility looks forward, providing an estimate of the potential volatility of an asset. It is often derived from the pricing of options and reflects market expectations of future volatility. A higher implied volatility often suggests that the market expects significant price movement, while a lower value might indicate a more stable price outlook. Investors use a variety of methods to calculate volatility, including the standard deviation of returns, beta coefficients, and option pricing models such as the Black Scholes method. In each case, an investor seeks to understand the degree that a security's price fluctuates, either to minimize risk or maximize return. Standard deviation is a statistical measure that provides an insight into the average variance from an investment's mean return. In the realm of finance, it's commonly used to gauge an investment's volatility. A higher standard deviation denotes greater volatility, indicating that the asset's price can potentially spread out over a larger range of values. The Average True Range is a technical indicator used primarily in the context of trading. It provides an insight into the volatility of asset prices, not the direction. ATR measures the average of true price ranges over a specified period, giving traders an understanding of the degree of price volatility. Often referred to as the 'fear index,' the VIX provides a measure of market risk and investor sentiment. It reflects the market's expectation of 30-day forward-looking volatility. A higher VIX value indicates that the market expects higher volatility, signaling investor uncertainty, while a lower VIX implies a more stable market outlook. Diversifying a portfolio across various asset classes and investments is one of the most effective ways to reduce exposure to volatility. By holding a mix of stocks, bonds, and other securities, the poor performance of one investment can potentially be offset by the better performance of another. Hedging involves taking an offsetting position in a related security, such as options or futures. This strategy aims to reduce the risk of adverse price movements in an asset. For example, an investor worried about a potential drop in a stock's price might purchase a put option as a hedge. Implementing risk management strategies involves setting stop-loss orders or using derivatives to protect an investment portfolio from unfavorable market movements. By determining the risk tolerance level and setting thresholds for potential losses, investors can ensure they minimize potential downside while capturing the upside. Volatility arbitrage involves taking a simultaneous long and short position in two different instruments, betting on the differential in their implied volatilities. Traders aim to profit from the price differences of these instruments, especially in the options market. Options are derivatives that derive their value from an underlying asset. Since options pricing is heavily influenced by volatility, traders can use strategies like straddles, strangles, or butterflies to trade volatility without having a specific directional bias on the asset. Futures contracts can also be used to trade volatility. These standardized contracts obligate the buyer to purchase, and the seller to sell, a specific asset at a predetermined price and date. Traders can take positions in volatility futures, such as the VIX futures, to speculate on future volatility movements. While volatility is the change or swing in an investment's returns, risk is the probability of permanent loss. Volatility becomes more closely related to risk when investors are planning to sell in the shorter term. For example, investors closer to retirement may be forced to sell stock in order to pay for their expenses and are therefore more averse to volatility. Long-term investors, however, do not associate volatility with risk as closely, and are, in general, more resilient. Warren Buffet, a famous long-term investor, stated the following about volatility: "Charlie and I would much rather earn a lumpy 15% over time than a smooth 12%." Larger market cap stocks are generally less volatile than smaller companies because the amount of market activity needed to move that stock's price is typically greater. This is why larger companies often have less perceived risk than smaller companies. Volatility is the change in an investment's performance over time and profoundly impacts investment decisions and risk management. Investors must understand the factors affecting volatility, including economic indicators, market sentiment, political events, and company-specific factors. Calculating volatility using standard deviation, ATR, and the VIX aids in decision-making. Diversification, hedging, and risk management strategies can help mitigate volatility's effects. Volatility trading strategies offer opportunities for profit. Differentiating between volatility and risk is crucial, particularly for long-term investors like Warren Buffet, who view volatility as a natural market element. Embracing volatility, employing risk-mitigating measures, and leveraging market fluctuations enable informed investment choices.Volatility Definition
Defining Volatility in Simple Terms
Factors Affecting Volatility
Economic Indicators
Market Sentiment
Political Events
Company-Specific Factors

Types of Volatility
Historical Volatility
Implied Volatility
Calculating Volatility
Standard Deviation
Average True Range (ATR)
Volatility Index (VIX)

How to Manage Volatility Risk
Diversify
Use Hedging Strategies
Implement Risk Management

Volatility Trading Strategies
Arbitrage
Trading Using Options
Trading Using Futures

Probability of Permanent Loss
Warren Buffet on Volatility
Large Cap or Small Cap?
Conclusion
Volatility FAQs
Volatility is the change in the performance of an investment over time.
Investors use a variety of methods to calculate volatility, including the standard deviation of returns, beta coefficients, and option pricing models such as the Black Scholes method.
Investors calculate volatility to seek to understand the degree that a security’s price fluctuates, either to minimize risk or maximize return.
Long term investors do not associate volatility with risk very closely, and are, in general, more resilient.
Larger market cap stocks are generally less volatile than smaller companies because the amount of market activity needed to move that stock’s price is typically greater.
True Tamplin is a published author, public speaker, CEO of UpDigital, and founder of Finance Strategists.
True is a Certified Educator in Personal Finance (CEPF®), author of The Handy Financial Ratios Guide, a member of the Society for Advancing Business Editing and Writing, contributes to his financial education site, Finance Strategists, and has spoken to various financial communities such as the CFA Institute, as well as university students like his Alma mater, Biola University, where he received a bachelor of science in business and data analytics.
To learn more about True, visit his personal website or view his author profiles on Amazon, Nasdaq and Forbes.


