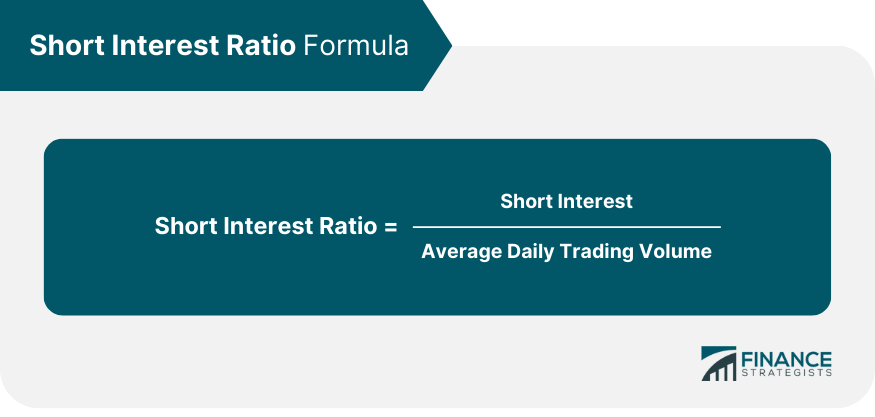
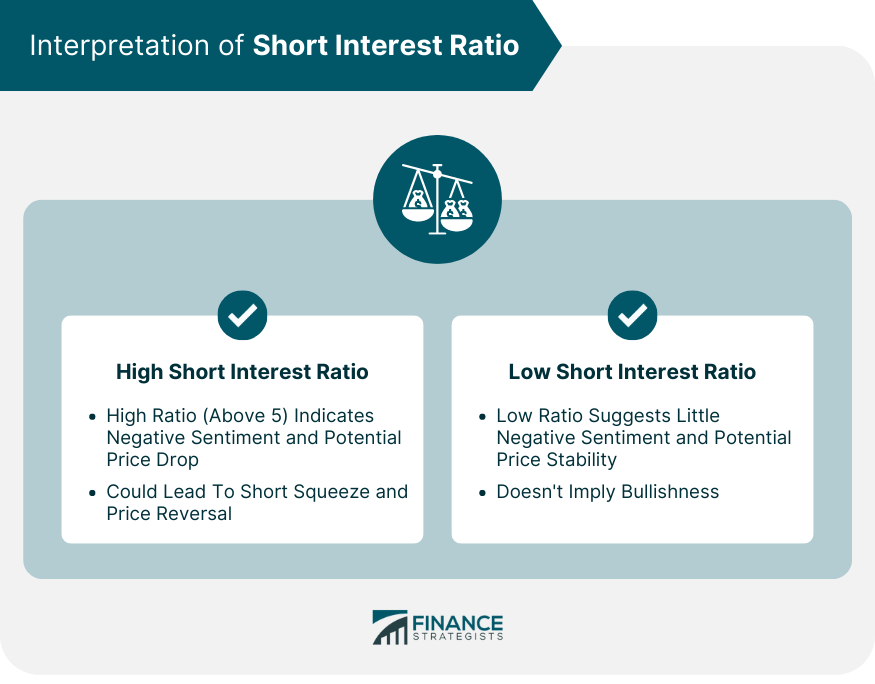
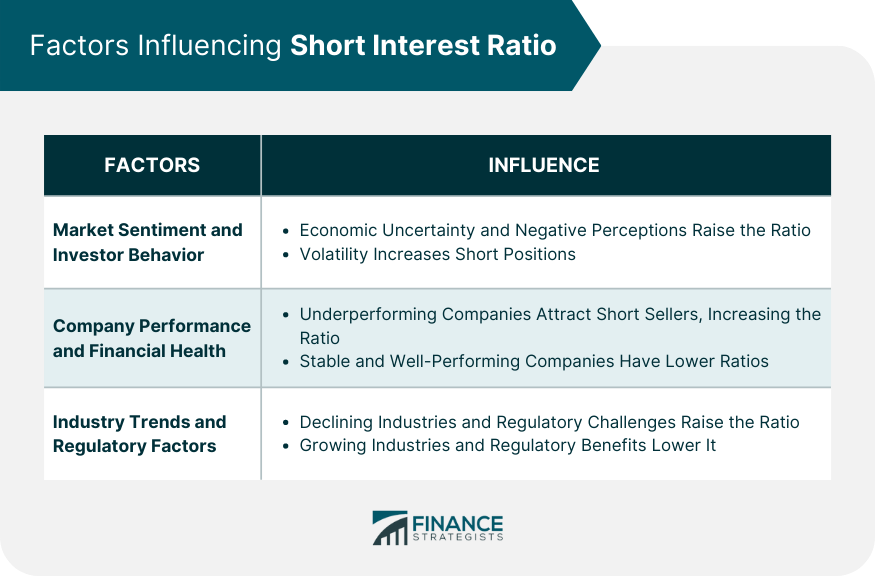
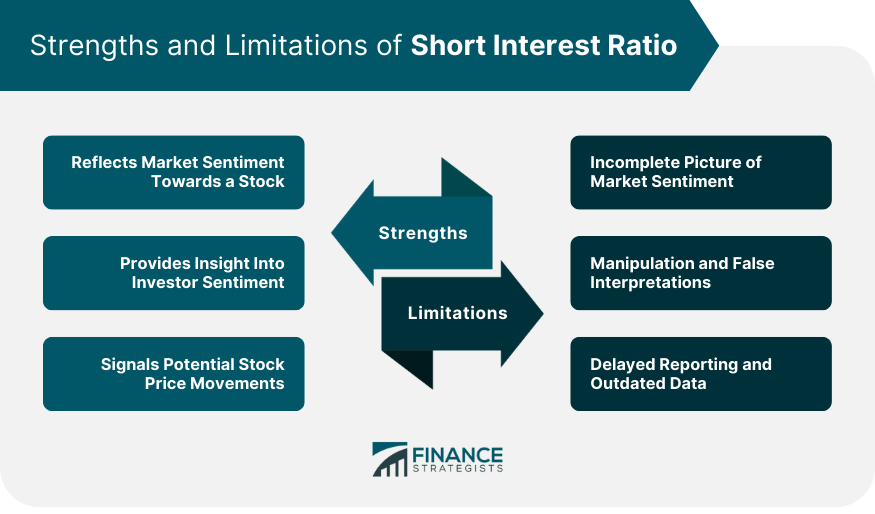
The Short Interest Ratio, often referred to as the "Days to Cover" ratio, is a popular metric in finance. It's computed by taking the total number of shares sold short in a company and dividing it by the average daily trading volume of the stock. The result represents the number of trading days it would take for all short positions to be covered, assuming the volume remains consistent. The Short Interest Ratio can provide a measure of the market's bearishness or bullishness toward a particular stock. A high ratio indicates that a significant portion of the market holds a negative view of the stock's prospects, implying it could take several days to cover all short positions. The Short Interest Ratio holds a critical position in the realm of finance, particularly for market participants interested in gauging market sentiment. Traders and investors often use it as a contrarian indicator to identify potential inflection points in a stock's price. When the ratio is high, it could suggest that a stock is overly shorted, and a price reversal might be imminent, especially if positive news about the company emerges. Conversely, a low ratio might suggest that there's little negative sentiment toward the stock, indicating a potentially stable price performance. Short interest refers to the number of shares that investors have sold short but have not yet covered. It's an important element in computing the Short Interest Ratio. This statistic is often used as a measure of market sentiment, with a high short interest indicating a bearish outlook and a low short interest suggesting a more bullish perspective. The short interest is divided by the average daily trading volume to determine the number of days it would take for all short positions to be covered, assuming the trading volume remains constant. Calculating the Short Interest Ratio involves two primary data points: the short interest and the average daily trading volume. The formula for the Short Interest Ratio is: The Short Interest Ratio is typically expressed in days. For example, a Short Interest Ratio of 3 suggests it would take three trading days to cover all short positions, given the current average daily trading volume. A high Short Interest Ratio—say, above 5—indicates a significant level of negative sentiment towards a stock. This is because a large number of investors have sold the stock short, suggesting they anticipate the price will fall. However, if the stock's price begins to rise, the high ratio could be a precursor to a short squeeze, a scenario where short sellers scramble to cover their positions, further pushing the price up. Therefore, a high Short Interest Ratio could sometimes signal a pending price reversal, although this is by no means a certainty. A low Short Interest Ratio, on the other hand, can indicate that there is little negative sentiment toward a stock. Fewer investors have sold the stock short, suggesting they do not anticipate a price decline. This could indicate a potentially stable price performance. However, a low Short Interest Ratio should not be interpreted as a positive indicator for the stock. The ratio only reflects market sentiment and doesn't take into account other factors, such as the company's fundamentals or broader market conditions. Therefore, while a low ratio might suggest less bearishness, it doesn't necessarily imply bullishness. During periods of economic uncertainty or market volatility, investors may be more inclined to short stocks, potentially leading to a high Short Interest Ratio. Similarly, if investors perceive a company's prospects negatively—perhaps due to poor financial performance, unfavorable news, or a declining industry outlook—they might increase their short positions, raising the Short Interest Ratio. The performance and financial health of a company are also crucial determinants of its Short Interest Ratio. If a company is underperforming compared to its peers or experiencing financial difficulties, it could attract short sellers, driving up its Short Interest Ratio. In contrast, a company that is financially sound and performing well may have a low Short Interest Ratio, reflecting the market's positive sentiment. Companies in industries facing declining demand or regulatory challenges may see their Short Interest Ratios increase as investors anticipate further price declines. Meanwhile, companies in growing industries or benefiting from regulatory changes may attract fewer short sellers, resulting in a lower Short Interest Ratio. One of the primary strengths of the Short Interest Ratio is its ability to provide a snapshot of market sentiment towards a particular stock. By analyzing the ratio, investors can gain insight into how the broader market views a company's prospects. A high Short Interest Ratio suggests that the market is bearish on the stock, while a low ratio may indicate less negative sentiment. This information can help investors make more informed decisions about their investment strategies. Beyond reflecting market sentiment, the Short Interest Ratio can also provide valuable insight into investor sentiment. The ratio reveals the extent of short-selling activity, which can offer clues about investor expectations and perceptions. For instance, a high Short Interest Ratio might suggest that investors are pessimistic about a company's prospects and anticipate a price decline. Conversely, a low ratio might indicate that investors have a more positive view of the company's outlook. The Short Interest Ratio can also serve as a potential signal for future stock price movements. A high Short Interest Ratio can sometimes precede a short squeeze, a rapid price increase driven by short sellers rushing to cover their positions. However, predicting a short squeeze is not straightforward, and the Short Interest Ratio should not be used as a standalone indicator for such price movements. Instead, it should be used in conjunction with other analytical tools and market indicators. While the Short Interest Ratio can provide insights into market sentiment, it only offers a partial picture. The ratio only considers short-selling activity and doesn't take into account other forms of trading or the various factors influencing investor sentiment. Moreover, the Short Interest Ratio doesn't differentiate between short selling for speculative purposes and hedging activities. Therefore, a high ratio doesn't necessarily mean that all short sellers anticipate a price decline. Some traders might attempt to manipulate the ratio to create an impression of negative sentiment and drive down a stock's price. Additionally, interpreting the Short Interest Ratio can be tricky. A high ratio might indicate bearish sentiment, but it could also set the stage for a short squeeze if the stock's price begins to rise. Therefore, the ratio should be used judiciously and in conjunction with other forms of analysis. The Short Interest Ratio is also subject to limitations related to reporting and data timeliness. Short interest data is typically reported twice a month, meaning the Short Interest Ratio can be outdated by the time it's available to investors. Given the rapidly changing dynamics of the stock market, this delay can limit the usefulness of the Short Interest Ratio as a real-time indicator of market sentiment. The Short Interest Ratio can have a relationship with stock price movements. A high ratio can sometimes signal a potential price reversal if the market sentiment shifts or if the company releases positive news. However, predicting price movements based solely on the Short Interest Ratio can be challenging. The ratio is merely an indicator of market sentiment and does not consider other crucial factors, such as the company's fundamentals or broader market conditions. One area where the Short Interest Ratio can be particularly useful is in identifying potential short squeezes. A short squeeze occurs when a heavily shorted stock starts to rise in price, forcing short sellers to buy the stock to cover their positions, which can further drive up the price. A high Short Interest Ratio can be a precursor to a short squeeze, although predicting such events is by no means easy. Therefore, while the Short Interest Ratio can be a valuable tool in an investor's toolkit, it should always be used in conjunction with other indicators and forms of analysis. The Short Interest Ratio, or "Days to Cover" ratio, is a critical financial metric that gauges market sentiment towards a stock. It's calculated by dividing the short interest by the average daily trading volume, and the resulting figure represents the number of trading days it would take for all short positions to be covered. This ratio provides a snapshot of investor sentiment, with a high ratio indicating bearish sentiment and a low ratio suggesting less negative sentiment. Several factors can influence the Short Interest Ratio, including market sentiment, company performance, and industry trends. The Short Interest Ratio offers several strengths, including its ability to reflect market sentiment, provide insight into investor sentiment, and signal potential stock price movements. However, it also has limitations, including providing an incomplete picture of market sentiment, the potential for manipulation, and the potential for delayed reporting and outdated data.What Is a Short Interest Ratio?
Importance of Short Interest Ratio
Calculation of Short Interest Ratio

Interpretation of Short Interest Ratio
High Short Interest Ratio
Low Short Interest Ratio

Factors Influencing Short Interest Ratio
Market Sentiment and Investor Behavior
Company Performance and Financial Health
Industry Trends and Regulatory Factors

Strengths of Short Interest Ratio
Reflects Market Sentiment Towards a Stock
Provides Insight Into Investor Sentiment
Signals Potential Stock Price Movements
Limitations of Short Interest Ratio
Incomplete Picture of Market Sentiment
Manipulation and False Interpretations
Delayed Reporting and Outdated Data

Short Interest Ratio as an Investment Indicator
Relationship With Stock Price Movements
Usefulness in Identifying Short Squeezes
Conclusion
Short Interest Ratio FAQs
A Short Interest Ratio, often referred to as the "Days to Cover" ratio, is a financial metric that measures the market sentiment toward a particular stock. It's calculated by dividing the total number of shares sold short by the average daily trading volume of the stock.
A high Short Interest Ratio indicates a significant level of negative sentiment toward a stock. It suggests that a large number of investors have sold the stock short, anticipating its price will fall. However, if the stock's price starts to rise, a high ratio could potentially lead to a short squeeze.
The Short Interest Ratio is calculated by dividing the total number of shares sold short by the average daily trading volume of the stock.
Several factors can influence the Short Interest Ratio, including market sentiment, company performance, financial health, industry trends, and regulatory factors.
Strengths of the Short Interest Ratio include its ability to reflect market sentiment, provide insight into investor sentiment, and signal potential stock price movements. Limitations include providing an incomplete picture of market sentiment, the potential for manipulation, and the delay in reporting, which can result in outdated data.
True Tamplin is a published author, public speaker, CEO of UpDigital, and founder of Finance Strategists.
True is a Certified Educator in Personal Finance (CEPF®), author of The Handy Financial Ratios Guide, a member of the Society for Advancing Business Editing and Writing, contributes to his financial education site, Finance Strategists, and has spoken to various financial communities such as the CFA Institute, as well as university students like his Alma mater, Biola University, where he received a bachelor of science in business and data analytics.
To learn more about True, visit his personal website or view his author profiles on Amazon, Nasdaq and Forbes.


