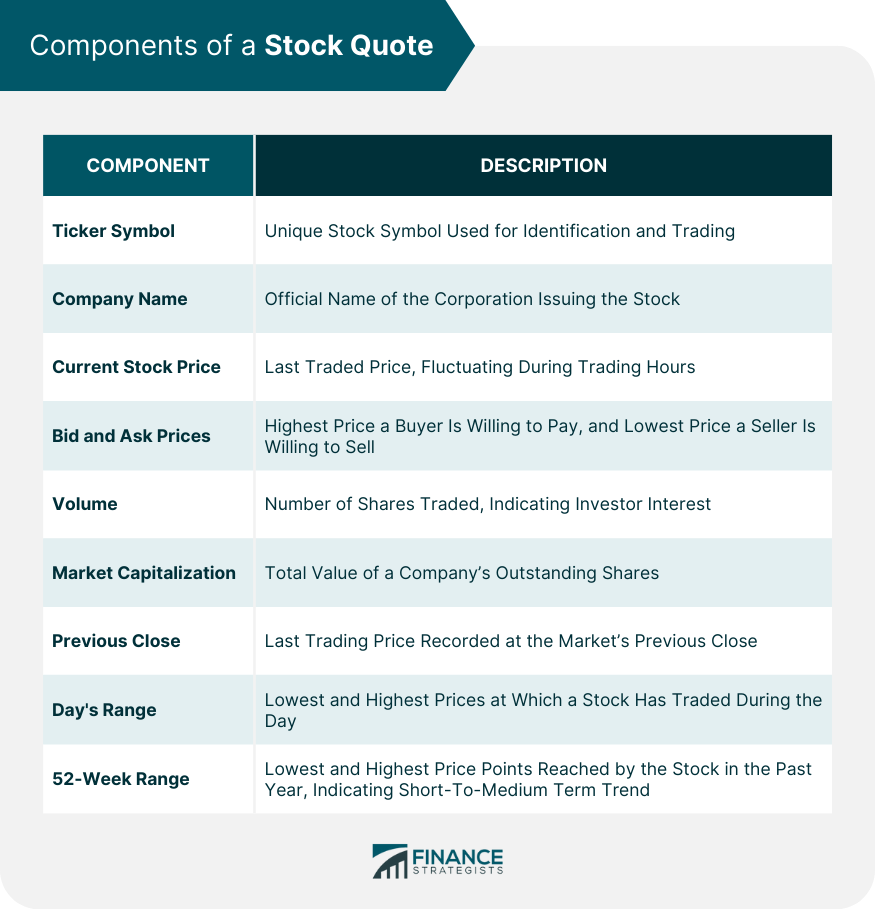
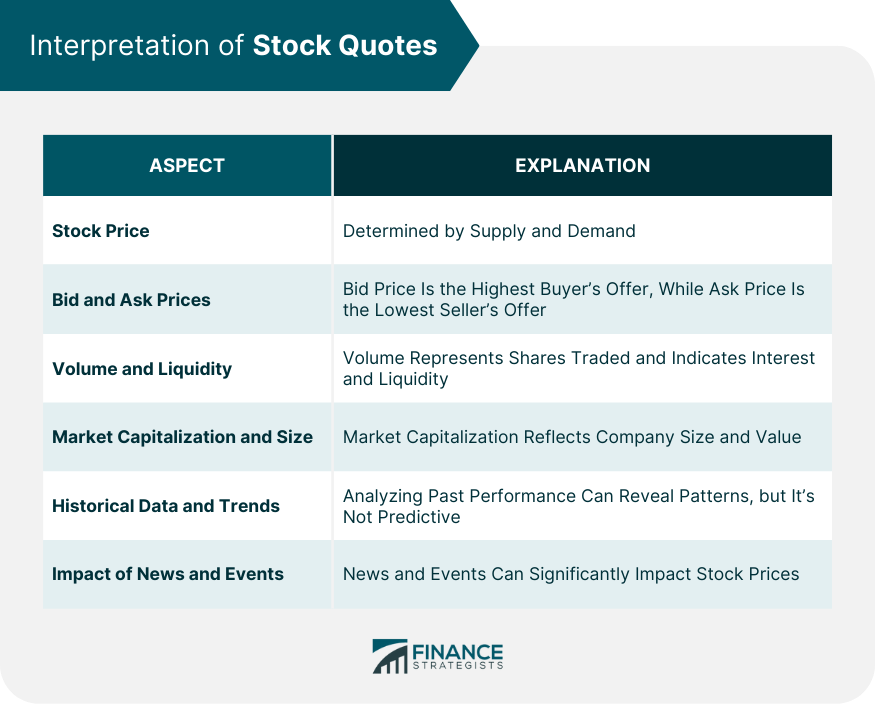
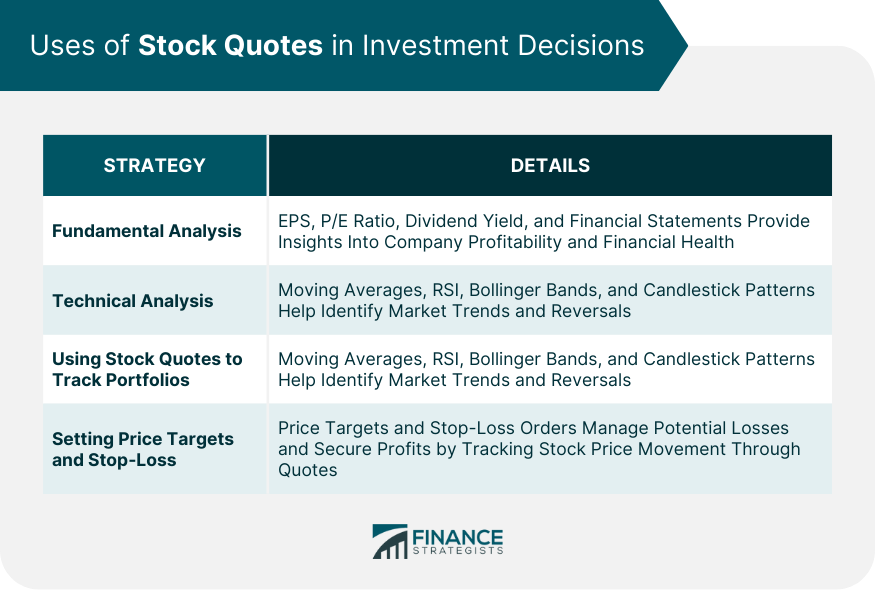
A stock quote provides a snapshot of a specific stock's price at a particular moment, encapsulating critical details like current price, trading volume, and market capitalization. These quotes, updated in real-time during trading hours, capture the continuous buying and selling activity influencing a stock's price. They are pivotal in financial markets, offering investors the latest information to make informed trading decisions, which is crucial due to the markets' fast-paced, volatile nature. The stock market, a complex economic ecosystem comprising multiple exchanges like the New York Stock Exchange (NYSE) and NASDAQ, is where shares of publicly traded companies are transacted. It reflects the collective decisions of millions of investors, driving the fluctuation of individual stock prices and impacting both national and global economies. Ticker Symbol: The ticker symbol is a unique series of letters representing a particular stock. Traders use ticker symbols to identify and trade stocks. For instance, Apple Inc. is represented as "AAPL" on the NASDAQ. Company Name: This component is the official name of the corporation issuing the stock. It helps investors to associate the stock with a particular company. Current Stock Price: The current stock price is the last price at which the stock was traded. It changes constantly during trading hours due to supply and demand in the market. Bid and Ask Prices: The bid price is the highest price a buyer is willing to pay for a stock, while the ask price is the lowest price at which a seller is willing to sell a stock. The difference between these two is known as the bid-ask spread. Volume: Volume indicates the number of shares traded during a specific period. High volume typically suggests strong investor interest and can signify the start of a new trend. Market Capitalization: Market capitalization, often shortened to market cap, is the total dollar value of a company's outstanding shares of stock. It's calculated by multiplying the current stock price by the total number of outstanding shares. Previous Close: The previous close is the last trading price recorded when the market closed on the previous trading day. It's often the starting point for the next day's trading. Day's Range: The day's range shows the lowest and highest prices at which a stock has traded during the trading day. 52-Week Range: This range indicates the lowest and highest price points the stock has reached in the last 52 weeks (one year). This can help investors gauge the stock's short-to-medium term trend. Stock exchanges like the NYSE, NASDAQ, and others provide real-time stock quotes for the companies listed on them. These are the most accurate sources as they reflect live trading activity. Several financial news and data websites provide stock quotes. These include well-known sites like Yahoo Finance, Google Finance, and Bloomberg. These sites not only offer current stock quotes but also a wealth of related financial data and news. Brokerage firms provide their clients with access to real-time stock quotes. These firms may offer sophisticated trading platforms with comprehensive tools for tracking and analyzing stock quotes. Examples include TD Ameritrade, E*Trade, and Fidelity. Real-time stock quotes are essential for investors who make decisions based on the most current data. Since stock prices fluctuate significantly throughout the trading day, delayed information can lead to missed opportunities or even financial losses. The technology powering real-time quotes involves complex data processing systems. Stock exchanges collect trading data, which is then processed and disseminated via various channels. Advanced servers and communication technologies ensure this information reaches investors without significant latency. Stock exchanges, such as NYSE and NASDAQ, provide real-time quotes for their listed securities. These are primary sources of such data. Companies like Bloomberg, Reuters, and FactSet collect, package, and distribute financial market data, including real-time quotes. Online brokerage platforms provide real-time quotes to their users. These platforms often come with integrated tools for analyzing and visualizing trading data. The stock price is dictated by market supply and demand. When more people want to buy a stock (demand) than sell it (supply), the price moves up. Conversely, if more people wished to sell a stock than buy it, there would be greater supply than demand, and the price would fall. The bid price is the maximum a buyer is willing to pay for a stock. The ask price, on the other hand, is the minimum a seller is willing to accept. A trade occurs when these prices match. Volume refers to the number of shares traded in a given period. High volume often means there's a lot of interest in the stock. Volume is also a key indicator of a stock's liquidity—the higher the volume, the easier it is to buy or sell shares without affecting the stock's price. Market capitalization is a quick way of determining a company's size and value. Companies with large market caps are considered more stable but may offer slower growth, while small-cap stocks may offer high growth potential but come with more risk. Looking at a stock's historical performance can help investors spot trends and patterns that may predict future performance. However, it's essential to remember that past performance is not indicative of future results. News and events can significantly impact stock prices. Earnings reports, changes in management, new product releases, and geopolitical events can all cause a stock's price to move. EPS is a portion of a company's profit allocated to each outstanding share of common stock. It's an important measure of a company's profitability. The P/E ratio is a valuation ratio calculated by dividing the market value per share by the EPS. A high P/E ratio could mean the stock is overpriced, while a low P/E may indicate it is undervalued. Dividend yield is a financial ratio that indicates how much a company pays out in dividends each year relative to its stock price. Analyzing a company's financial statements provides insight into its financial health and long-term profitability. Technical analysis involves analyzing statistical trends gathered from trading activity, such as price movement and volume. Moving averages smooth out price data to form a trend-following indicator. They can help identify the direction of the market. RSI is a momentum indicator used to identify overbought or oversold conditions in a price trend. Bollinger Bands are volatility bands placed above and below a moving average, where the volatility is based on standard deviation, which changes as volatility increases or decreases. Candlestick patterns are chart patterns that showcase buying and selling forces in the market. They can provide early indications of market reversals. Investors can use real-time stock quotes to monitor their investment portfolios and make timely decisions based on price movements. Setting price targets and stop-loss orders can help manage potential losses and secure profits. Investors set these levels based on the stock's price movement, which they track through real-time quotes. Stock quotes fluctuate based on market conditions, which can be influenced by many factors, including economic indicators, company news, and global events. While real-time quotes are ideal, not all platforms provide them. Delayed quotes can result in decisions based on outdated information. The difference between the bid price and the ask price can impact an investor's potential profit. Additionally, transaction costs can eat into returns. Investors must be aware of their biases and avoid emotional trading decisions. It's essential to make informed decisions based on solid analysis rather than reacting impulsively to real-time stock quotes. A stock quote provides essential information about a particular stock's trading activity at a specific point in time. Its components, such as the ticker symbol, company name, current stock price, volume, and market capitalization, among others, offer a snapshot of a stock's current market position. These quotes can be sourced from stock exchanges, financial websites and portals, and brokerage firms. Interpretation of these quotes requires understanding of several elements including the stock price, bid and ask prices, volume and liquidity, and historical data and trends. While stock quotes provide valuable real-time data, they should be used as part of a comprehensive investment strategy. This strategy should account for individual financial goals, market conditions, and thorough financial analysis. It is beneficial to seek the help of professionals in wealth management services to better understand and use these quotes for maximum investment returns.What Is a Stock Quote?
Components of a Stock Quote
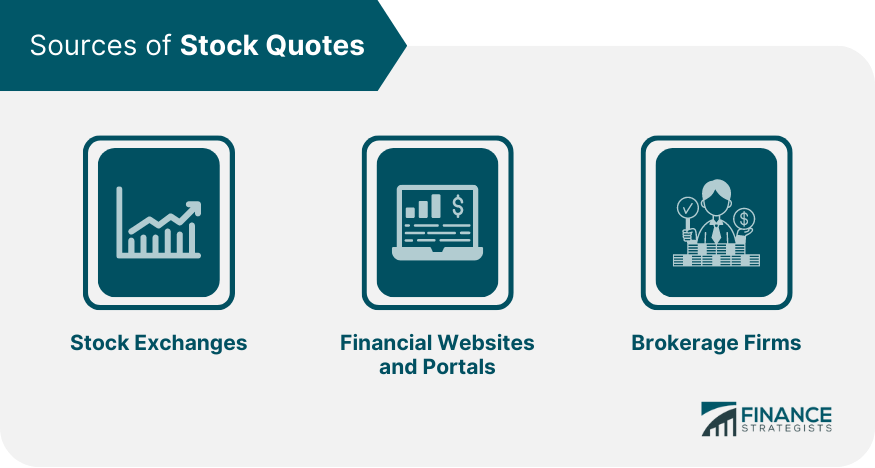
Sources of Stock Quotes
Stock Exchanges
Financial Websites and Portals
Brokerage Firms
Real-Time Stock Quotes
Importance of Real-Time Stock Quotes
Technology and Infrastructure Behind Real-Time Quotes
Real-Time Quote Providers
Stock Exchanges
Financial Data Vendors
Trading Platforms
Interpreting Stock Quotes
Understanding the Stock Price
Bid and Ask Prices
Volume and Liquidity
Market Capitalization and Size
Historical Data and Trends
Impact of News and Events on Stock Quotes
Using Stock Quotes for Investment Decisions
Fundamental Analysis
Earnings per Share (EPS)
Price-To-Earnings Ratio (P/E Ratio)
Dividend Yield
Financial Statements
Technical Analysis
Moving Averages
Relative Strength Index (RSI)
Bollinger Bands
Candlestick Patterns
Using Stock Quotes to Track Portfolios
Setting Price Targets and Stop-Loss Orders
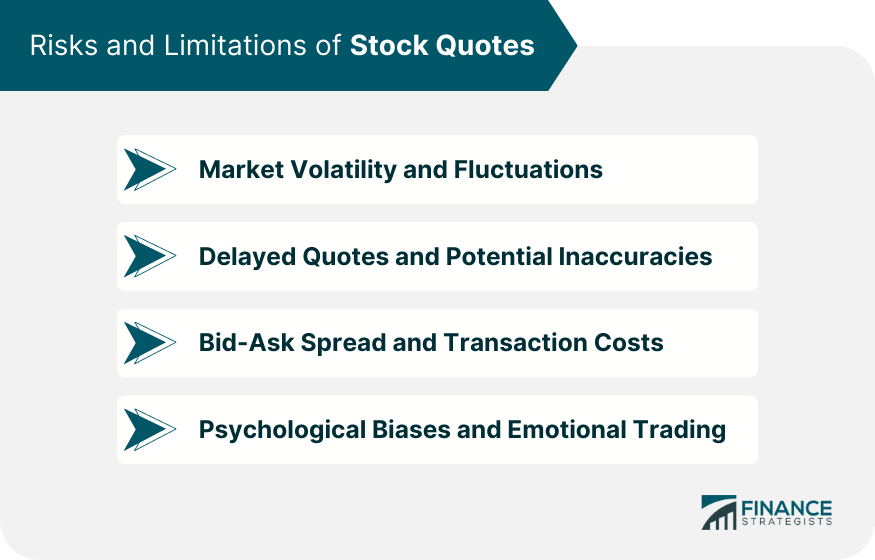
Risks and Limitations of Stock Quotes
Market Volatility and Fluctuations
Delayed Quotes and Potential Inaccuracies
Bid-Ask Spread and Transaction Costs
Psychological Biases and Emotional Trading
Final Thoughts
Stock Quote FAQs
A stock quote is a summary of a particular stock's trading activity, providing information like the current price, bid and ask prices, volume, and historical data.
Stock quotes provide investors with real-time information about a stock's price and trading activity, helping them make informed buying or selling decisions.
Stock quotes can be found on stock exchanges, financial news and data websites, and through brokerage firms.
Interpreting a stock quote involves understanding its components such as the stock price, bid and ask prices, volume, market capitalization, and historical data.
Yes, stock quotes provide essential data that can inform investment decisions. However, they should be used as part of a broader investment strategy, considering various other factors.
True Tamplin is a published author, public speaker, CEO of UpDigital, and founder of Finance Strategists.
True is a Certified Educator in Personal Finance (CEPF®), author of The Handy Financial Ratios Guide, a member of the Society for Advancing Business Editing and Writing, contributes to his financial education site, Finance Strategists, and has spoken to various financial communities such as the CFA Institute, as well as university students like his Alma mater, Biola University, where he received a bachelor of science in business and data analytics.
To learn more about True, visit his personal website or view his author profiles on Amazon, Nasdaq and Forbes.


