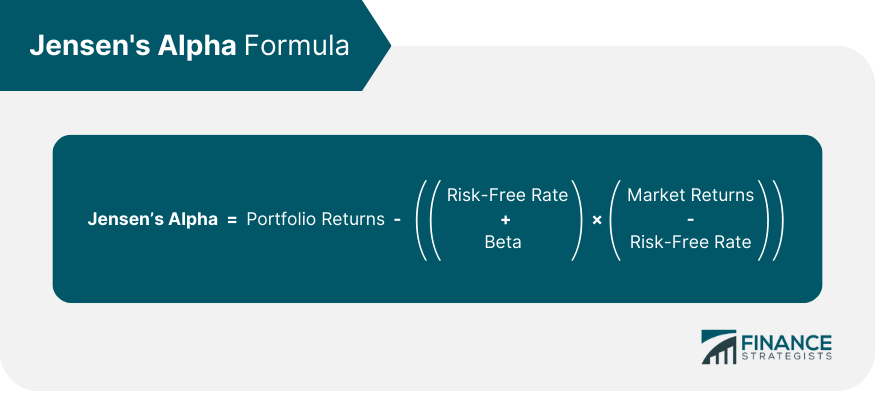
Jensen's alpha, also known as Jensen's measure, is a risk-adjusted performance metric used in finance to evaluate the excess returns generated by a portfolio or investment relative to its expected returns, given its level of risk as measured by the capital asset pricing model (CAPM). Jensen's alpha is an essential tool in portfolio management. It helps investors and fund managers assess whether a portfolio generates superior returns due to effective investment strategies or simply taking on additional risk. It is particularly useful in determining the skill of portfolio managers in generating value for investors. Jensen's alpha measures the difference between a portfolio's actual returns and its expected returns based on the CAPM. A positive Jensen's alpha indicates that a portfolio has generated higher returns than expected for its level of risk, while a negative alpha suggests underperformance. Jensen's alpha is directly connected to CAPM as it incorporates the concept of systematic risk, represented by the beta coefficient. Systematic risk is the risk inherent to the overall market, which cannot be eliminated through diversification. Jensen's alpha is used to evaluate the risk-adjusted performance of portfolios, assess fund managers' skill in generating value, and identify superior investment strategies. The actual returns generated by the portfolio during the evaluation period. Government bond yields typically represent the return on a risk-free investment. During the evaluation period, the returns of a broad market index, such as the S&P 500. A measure of the portfolio's systematic risk in relation to the market. Jensen's alpha can be calculated using the following formula: A positive Jensen's alpha indicates that the portfolio has outperformed its expected returns based on its level of risk, suggesting superior investment performance. A negative alpha indicates underperformance relative to the expected risk-return relationship. Jensen's alpha provides insight into a portfolio's performance after accounting for the level of risk involved, allowing investors to compare investments with different risk levels on a comparable basis. By isolating the impact of a portfolio manager's investment decisions from market movements, Jensen's alpha can help determine whether a manager adds value through their investment strategies or merely benefits from overall market trends. A positive Jensen's alpha can indicate that an investment strategy is consistently generating above-average returns compared to its level of risk, suggesting that the strategy may be more effective than others. Jensen's alpha is calculated using historical data, which may not necessarily be indicative of future performance. The validity of Jensen's alpha relies on the assumptions underlying the CAPM, such as the existence of a risk-free rate and the linear relationship between risk and expected returns. If these assumptions do not hold, the accuracy of Jensen's alpha as a performance measure may be compromised. Jensen's alpha can be sensitive to changes in market conditions, making it essential for investors to consider how different market environments may affect their portfolio's risk-adjusted performance. The Sharpe ratio measures a portfolio's risk-adjusted return by comparing excess returns to standard deviation. A higher Sharpe ratio indicates better risk-adjusted performance. The Treynor ratio is similar to the Sharpe ratio but uses the beta coefficient as a measure of risk instead of the standard deviation. It is particularly useful for comparing the performance of diversified portfolios. The Sortino ratio is a variation of the Sharpe ratio that only considers downside risk or the risk of negative returns. It is useful for investors who are more concerned with downside risk than overall volatility. The information ratio measures the excess returns of a portfolio relative to a benchmark index, divided by the tracking error, which is the standard deviation of the excess returns. It is useful for evaluating the performance of active investment strategies compared to passive benchmarks. Investors can use Jensen's alpha to select investments with superior risk-adjusted performance, helping to build more efficient portfolios that optimize returns for a given level of risk. By comparing Jensen's alpha of different fund managers, investors can identify those with a consistent track record of generating excess returns, potentially leading to better investment outcomes. Jensen's alpha can be used as a benchmark to evaluate the performance of individual investments or entire portfolios, allowing investors to make more informed decisions about their investment strategies and allocations. Jensen's alpha is an essential tool in portfolio management, providing valuable insights into the risk-adjusted performance of investments and the effectiveness of portfolio managers. While it has its limitations, such as its reliance on historical data and the assumptions of the CAPM, it remains a valuable metric when used in conjunction with other performance measures. By considering Jensen's alpha as part of a comprehensive approach to investment evaluation, investors can make more informed decisions and ultimately achieve better long-term financial outcomes.What Is Jensen's Alpha?
Understanding Jensen's Alpha
Conceptual Basis of Jensen's Alpha
Connection to CAPM and Systematic Risk
Applications of Jensen's Alpha in Portfolio Evaluation
Calculating Jensen's Alpha
Required Data for Calculation
Portfolio Returns
Risk-Free Rate
Market Returns
Beta Coefficient
Jensen's Alpha Formula

Interpreting the Results of Jensen's Alpha Calculation
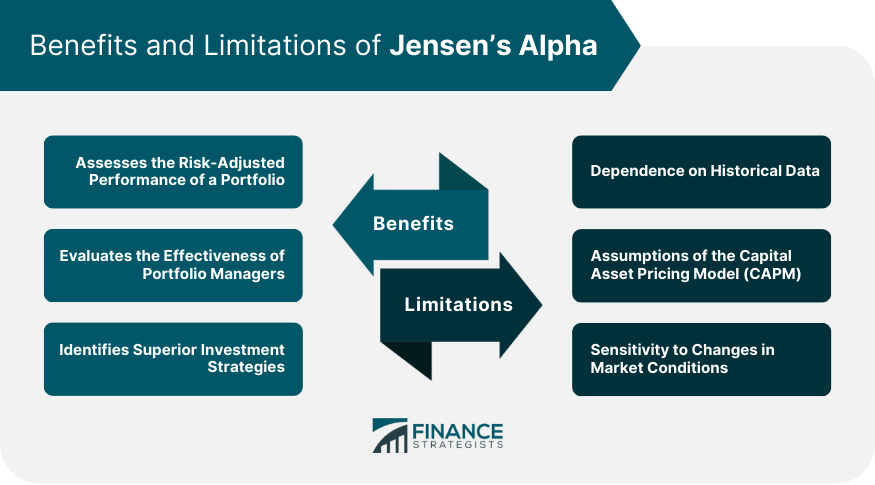
Benefits and Limitations of Jensen's Alpha
Benefits
Assesses the Risk-Adjusted Performance of a Portfolio
Evaluates the Effectiveness of Portfolio Managers
Identifies Superior Investment Strategies
Limitations
Dependence on Historical Data
Assumptions of the CAPM
Sensitivity to Changes in Market Conditions

Jensen’s Apha vs Other Performance Evaluation Measures
Sharpe Ratio
Treynor Ratio
Sortino Ratio
Information Ratio
Practical Applications of Jensen's Alpha
Portfolio Construction
Manager Selection and Evaluation
Benchmarking Investment Performance
Conclusion
Jensen's Alpha FAQs
Jensen's alpha is a metric used to evaluate the performance of an investment portfolio or an individual security by comparing its returns against a benchmark index. It measures the portfolio's excess returns over the expected returns based on its beta.
Jensen's alpha is calculated by subtracting the expected returns of the portfolio based on its beta from the actual returns of the portfolio and then dividing the result by the portfolio's standard deviation.
A positive Jensen's alpha indicates that the portfolio has generated excess returns compared to what would be expected based on its beta and the performance of the benchmark index. This suggests that the portfolio manager has added value through active management.
Yes, Jensen's alpha can be negative. A negative Jensen's alpha indicates that the portfolio has underperformed compared to what would be expected based on its beta and the performance of the benchmark index.
One limitation of Jensen's alpha is that it assumes that the benchmark index is suitable for the portfolio being evaluated. Another limitation is that it needs to consider the risk level taken by the portfolio manager. Additionally, it is sensitive to the choice of the benchmark index and the time period over which the analysis is conducted.
True Tamplin is a published author, public speaker, CEO of UpDigital, and founder of Finance Strategists.
True is a Certified Educator in Personal Finance (CEPF®), author of The Handy Financial Ratios Guide, a member of the Society for Advancing Business Editing and Writing, contributes to his financial education site, Finance Strategists, and has spoken to various financial communities such as the CFA Institute, as well as university students like his Alma mater, Biola University, where he received a bachelor of science in business and data analytics.
To learn more about True, visit his personal website or view his author profiles on Amazon, Nasdaq and Forbes.


